[1] The “Grid Information Service” on which the published data is posted may not be compatible with display depending on the web browser.
- Ministry of Economy, Trade and Industry website – 11th meeting of the General Energy and Resources Survey Committee on Electricity and Gas Utility Subcommittee on Electricity and Gas Basic Policies / Document 3-1 Progress on Liberalization of Electricity Retail (in Japanese)
- Ministry of Economy, Trade and Industry website – 12th General Resources and Energy Research Committee Electricity and Gas Business Subcommittee Electricity / Gas Basic Policy Subcommittee / Document 3-1 Progress on Full Electricity Retail Liberalization (in Japanese)
As stated in “Concept” of ISEP Energy Chart, it is inspired by European countries where the prevalence of renewable energy has progressed, data on energy is disclosed in a timely manner, and based on published data, government agencies and independent research institutions and others have visualized them and used them for research and policy recommendations.
The fact that information provided by OCCTO began this time means that this movement will accelerate in Japan. In addition, as for the visualization of data, each approach can be expected to mutually enhance sound competition, so that it will be possible for users to provide easy-to-understand information.
Below, let’s look at the difference between OCCTO’s published data and ISEP Energy Chart’s main features on electricity supply and demand information.
Publication time
- OCCTO is announced at the beginning of the next month (each general transmission and distribution company announces at the end of the next month)
- ISEP Energy Chart will publish in the middle of the next month (We plan to update the system for speeding up in the future)
Publication information
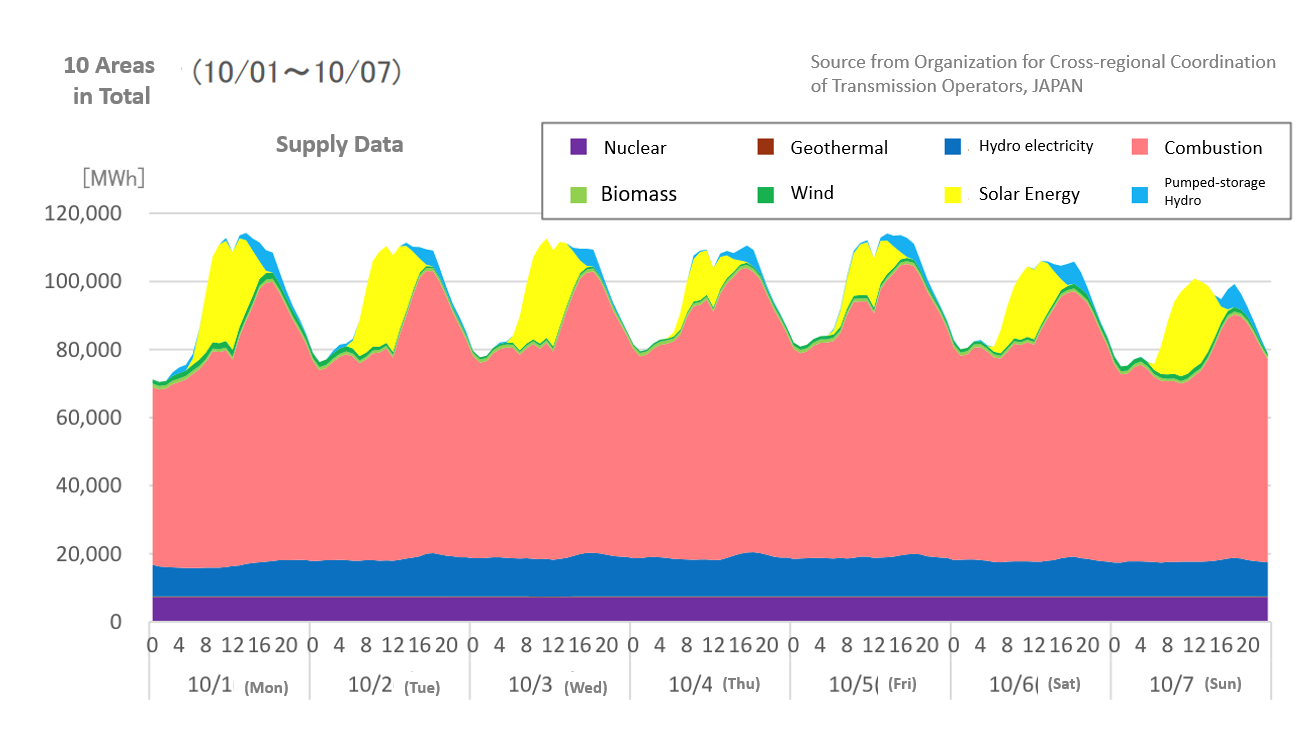
- OCCTO provides numerical data and graphs of 10 area in total, and graphs for each area (numerical data of each area is publicized by general transmission and distribution business operators)
- ISEP Energy Chart can use numerical data and graphs for each area and 10 areas in total
Graph details
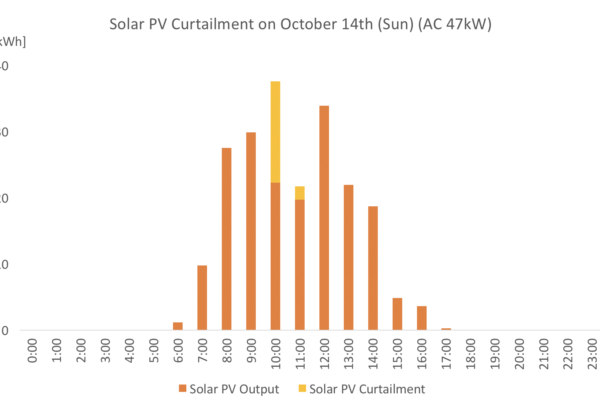
- OCCTO publishes results of supply every week, demand, etc., photovoltaic power generation and curtailment performance, wind power generation and curtailment performance in PDF
- ISEP Energy Chart publishes supply and demand results in an interactive graph. Displayable from 1 day to 12 months from any date. By clicking on the legend, you can select any power generation source and display it, so you can also display solar power generation and curtailment results. Switching between stacking method and residual demand method can be selected.
Other information provision (electricity supply and demand related)
- OCCTO displays real-time power usage and lineage related
- ISEP Energy Chart is equipped with the maximum and minimum search functions by displaying share by power configuration and searching.
ISEP Energy Chart will continue to improve its functions and visualize new data.