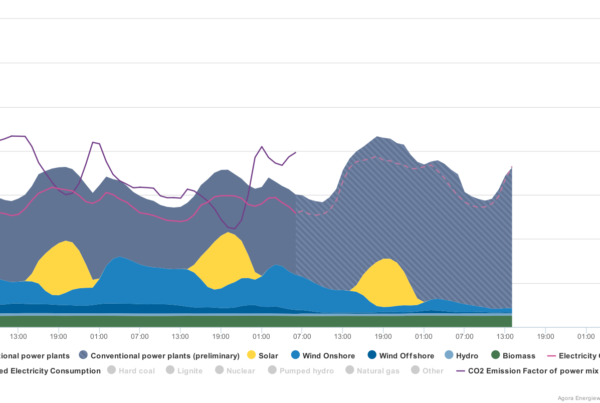
The third part of the series of articles about our information exchange with Agora Energiewende is about the advice on the ISEP Energy Chart. The overall reaction on the ISEP Energy chart was positive. For example, the search function for the maximum and minimum share of renewable energy for a given period was regarded as an interesting feature.
We received the following advice to further improve the ISEP Energy Chart:
Release of annual reports
Agora Energiewende publishes a report(German, English in part ) on the status of German’s energy transition in the electricity sector every year . It forms a good basis for annual comparisons of the electricity sector in Germany.
We plan to provide such reports for the FY2016 and FY2017 in Japan.
A Graph which shows CO2 emissions
The Agorameter calculates CO2 emissions based on real-time power generation data. The data of each conventional power source, such as lignite, coal, and natural gas is provided separately in Germany. Therefore, the CO2 emissions can be calculated with precision. However, only the combined data of all fossil fuel power sources in Japan are published. This makes the calculation in the Japanese case very imprecise, since the CO2 emissions of, for example, coal and gas vary widely.
Overview of all available energy charts
The Agorameter provides an overview of graphs on: power generation and consumption; power imports/exports; power prices, generation, consumption; and power price and emission. We are planning to introduce such an overview ourselves .
We will use the information and advice by Agora Energiewende to improve the usability and to make our energy charts even better.


