
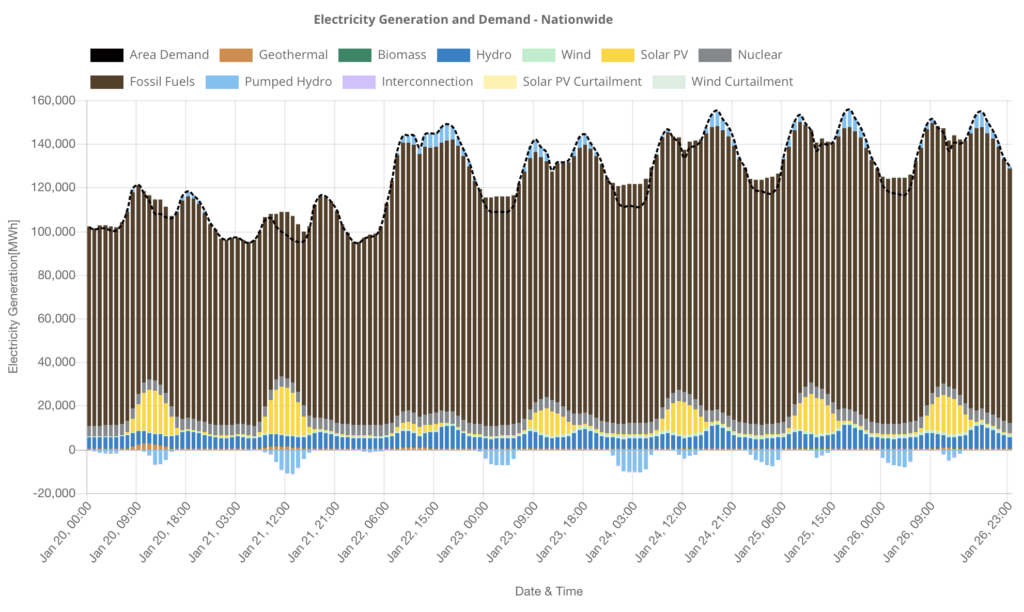
There was a mistake in data concerning the “Electricity Generation and Demand – Nationwide”, “Renewable Energy Share in Electricity – Nationwide” and others.
ISEP Energy Chart updated the data for each electric power company and across Japan from April to June,2018. Data can be found under “Electricity Generation and Demand”, “Renewable Energy Share in Electricity”, “Data Search” tags.
Renewable energy has exceeded 100% of electricity consumption in Shikoku Area.
ISEP Energy Chart has updated data for each electric power company and across Japan from January to March 2018. “Electricity generation and demand” can now graph the solar PV generation and demand situation on January 22nd, 2018 when heavy snowfall happened in the TEPCO area.
The snow in the metropolitan area significantly reduced solar power generation and the supply and demand were tightened?
ISEP Energy Chart is an energy data visualization project conducted by ISEP. Interpret the rapid development of renewable energies through data analysis.