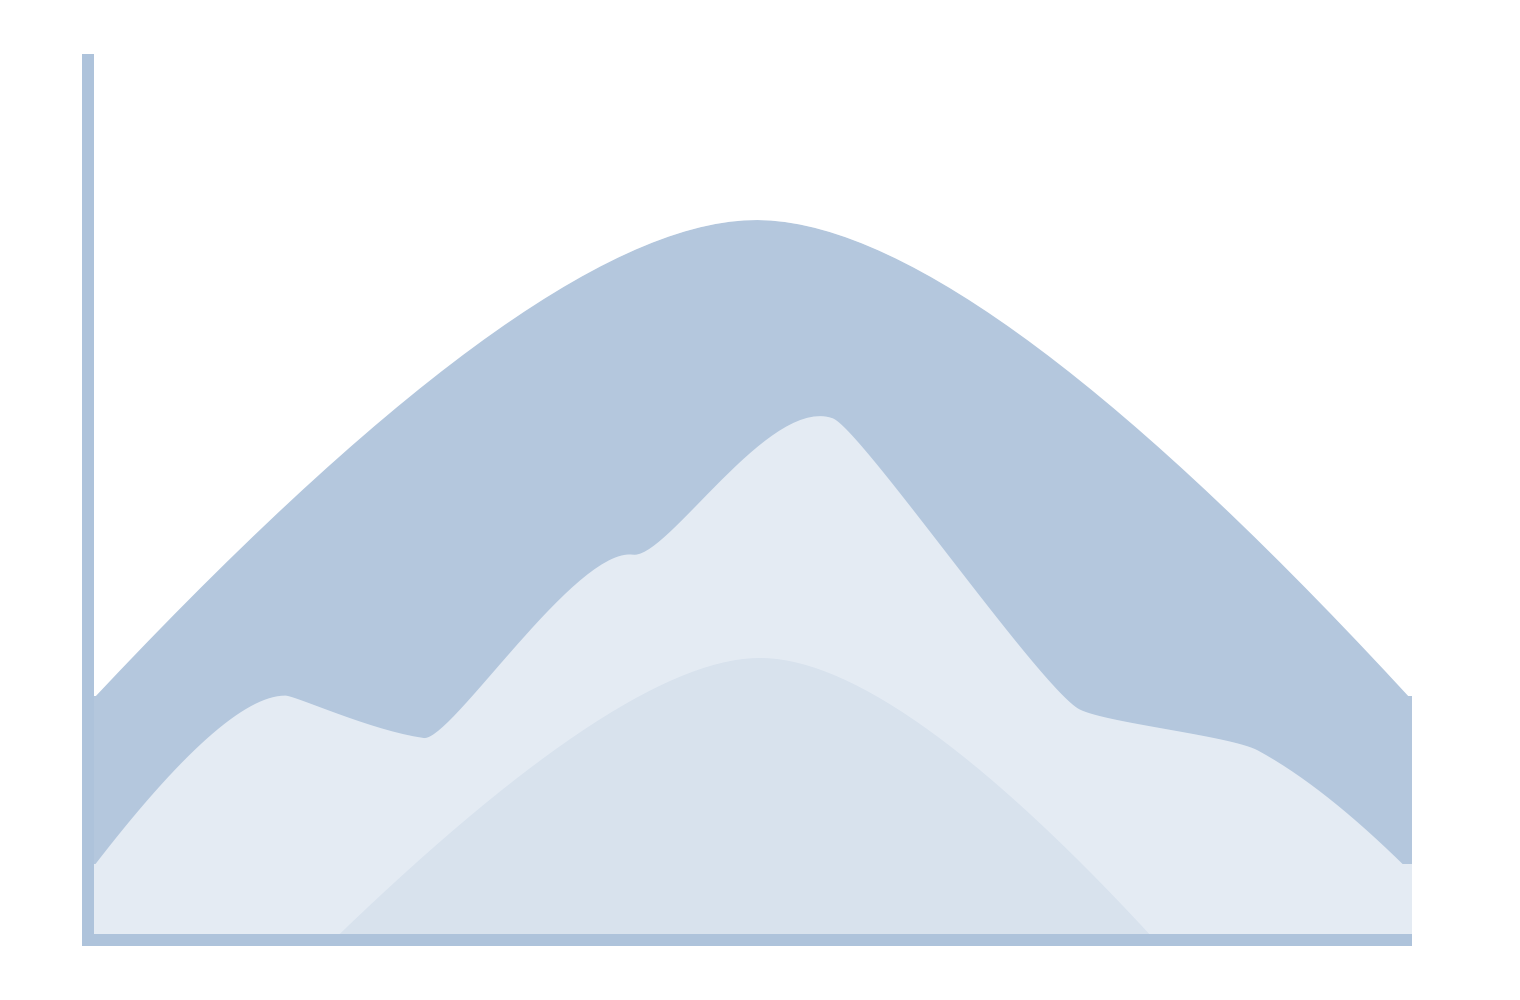
View graphs which show the electricity generation and demand from various sources for a specified region and its time period.
ISEP Energy Chart provides interactive graphs on Electricity Generation and Demand, Renewable Energy Share in Electricity, Cumulative Installed Capacity (Electricity or Heat), and Bar Chart Race (Solar PV or Wind).
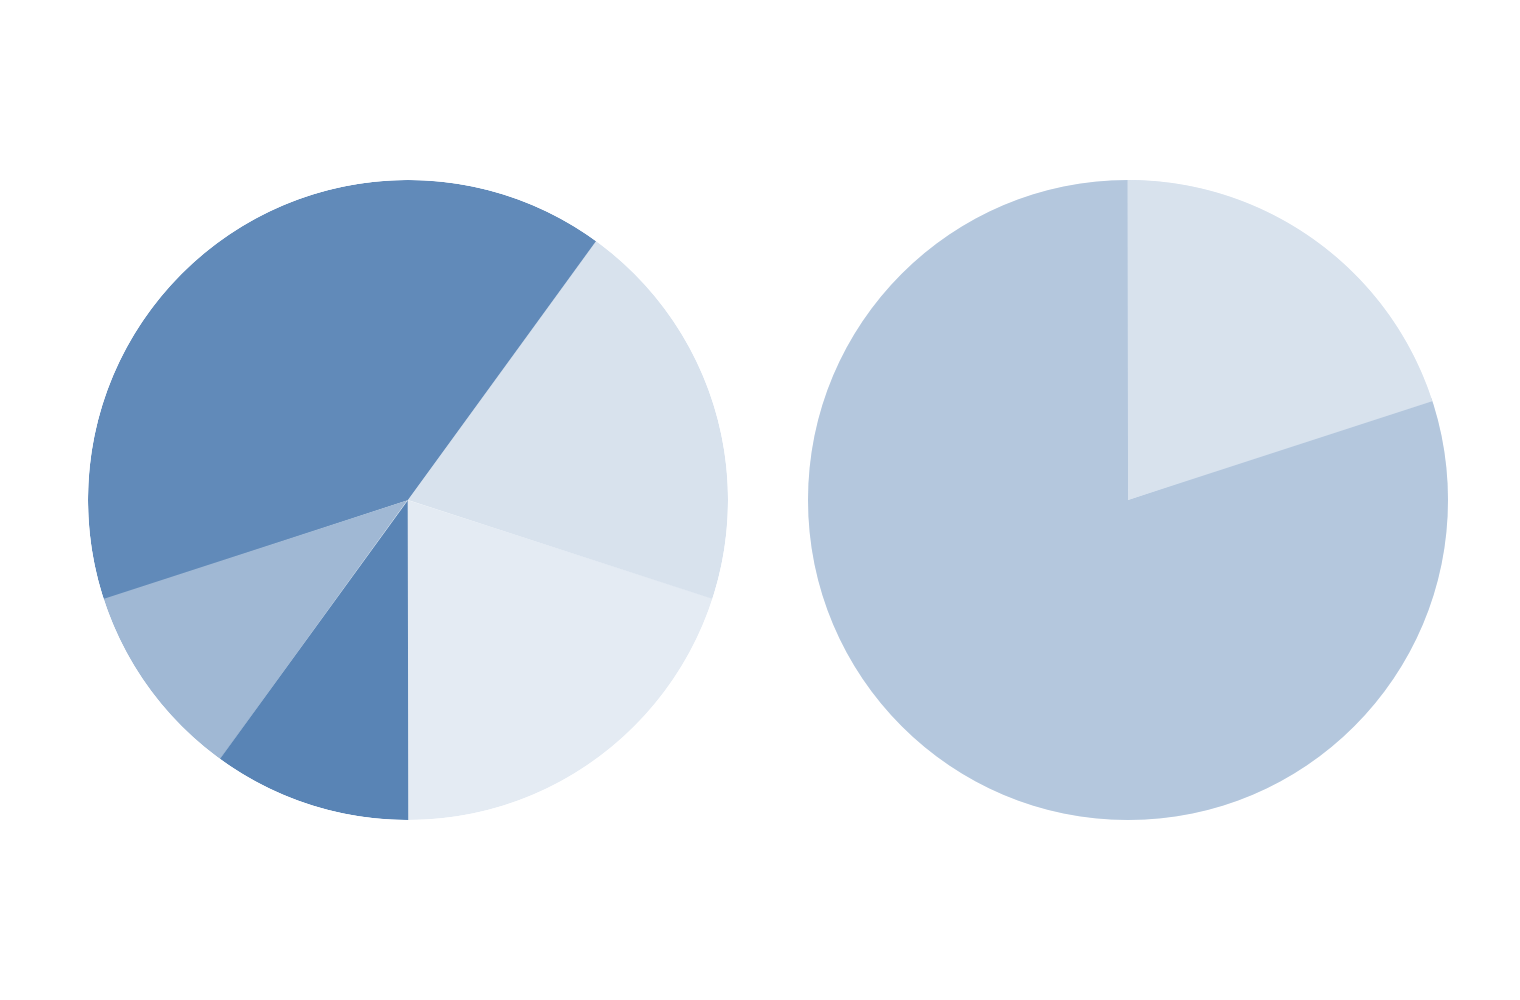
Renewable Energy Share in Electricity
View pie charts of the distribution of electricity generation from various sources for a specified region and its time period.
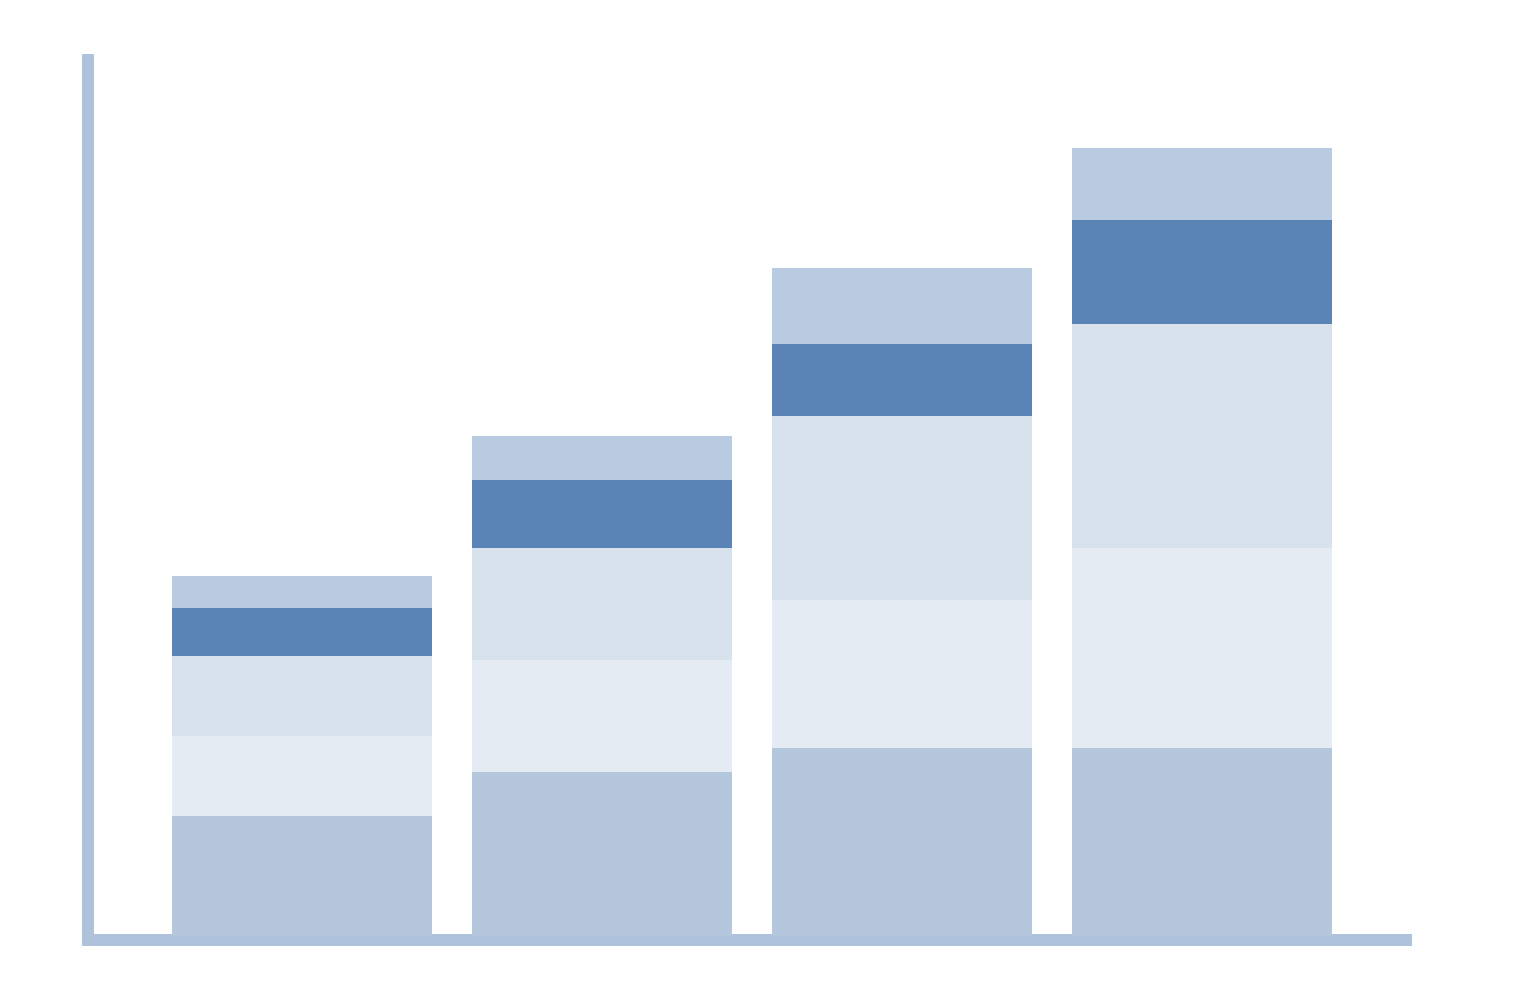
Cumulative Installed Capacity
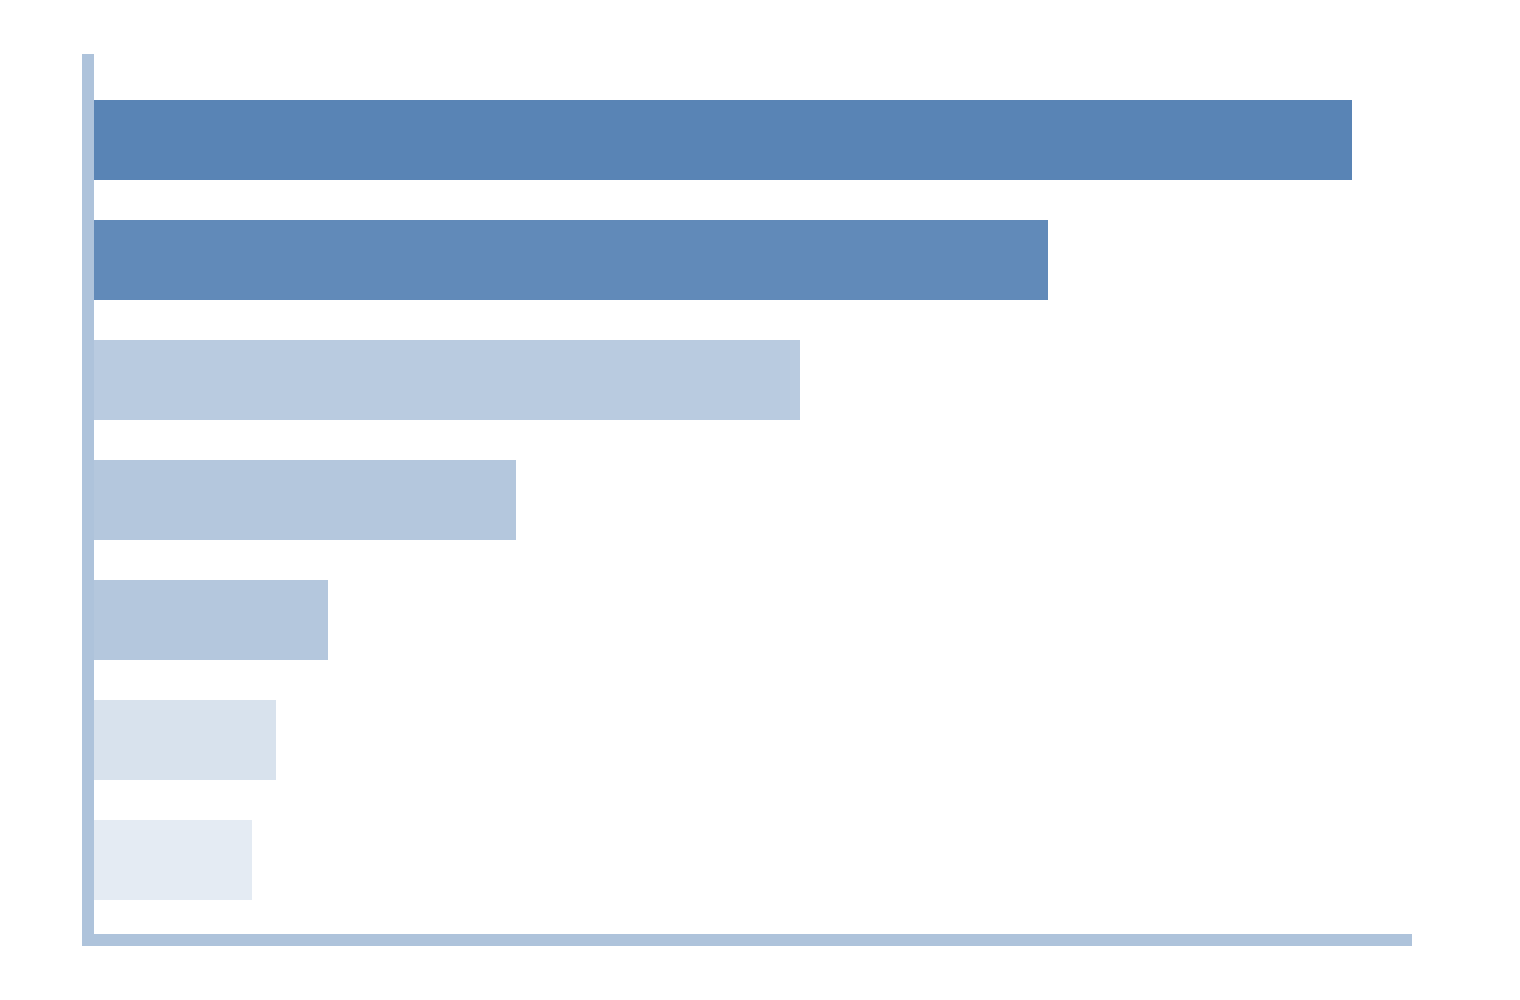
View bar graphs of the annual culumative generation capacity of installed renewable energy facilities.
Bar Chart Race
View a time series animation of the cumulative solar and wind power installed in each country and region.