The energy demand and supply data until December 2018 has been released. In view of this, a prompt report about the summary of the nationwide energy data in 2018 is scheduled to be issued soon. This time, the renewable energy rate is shown.
The hourly demand and supply data is released by each general transmission and distribution company every three months until September 2018, and every month from October 2018. December 2018 data was published in mid-February, prompting analysis of the nationwide data from January to December 2018.
Information for that period, concerning the summary of the electricity demand and supply in 2018, will be covered in a five-part blog post. In Japan, the data is basically shown annually from April to March, but other countries’ reports display data each year from January to December. Both types of data will be provided, since ISEP Energy Chart disseminates information to overseas.
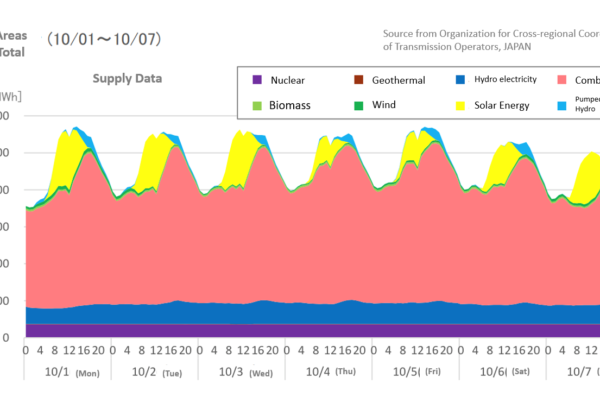
Based on the data displayed in the graph above, the ratio of renewable energy is summarized below. This data illustrates the energy transferred by the power transmission and distribution networks. Please, take note self-consumption in private houses and corporations is not included.
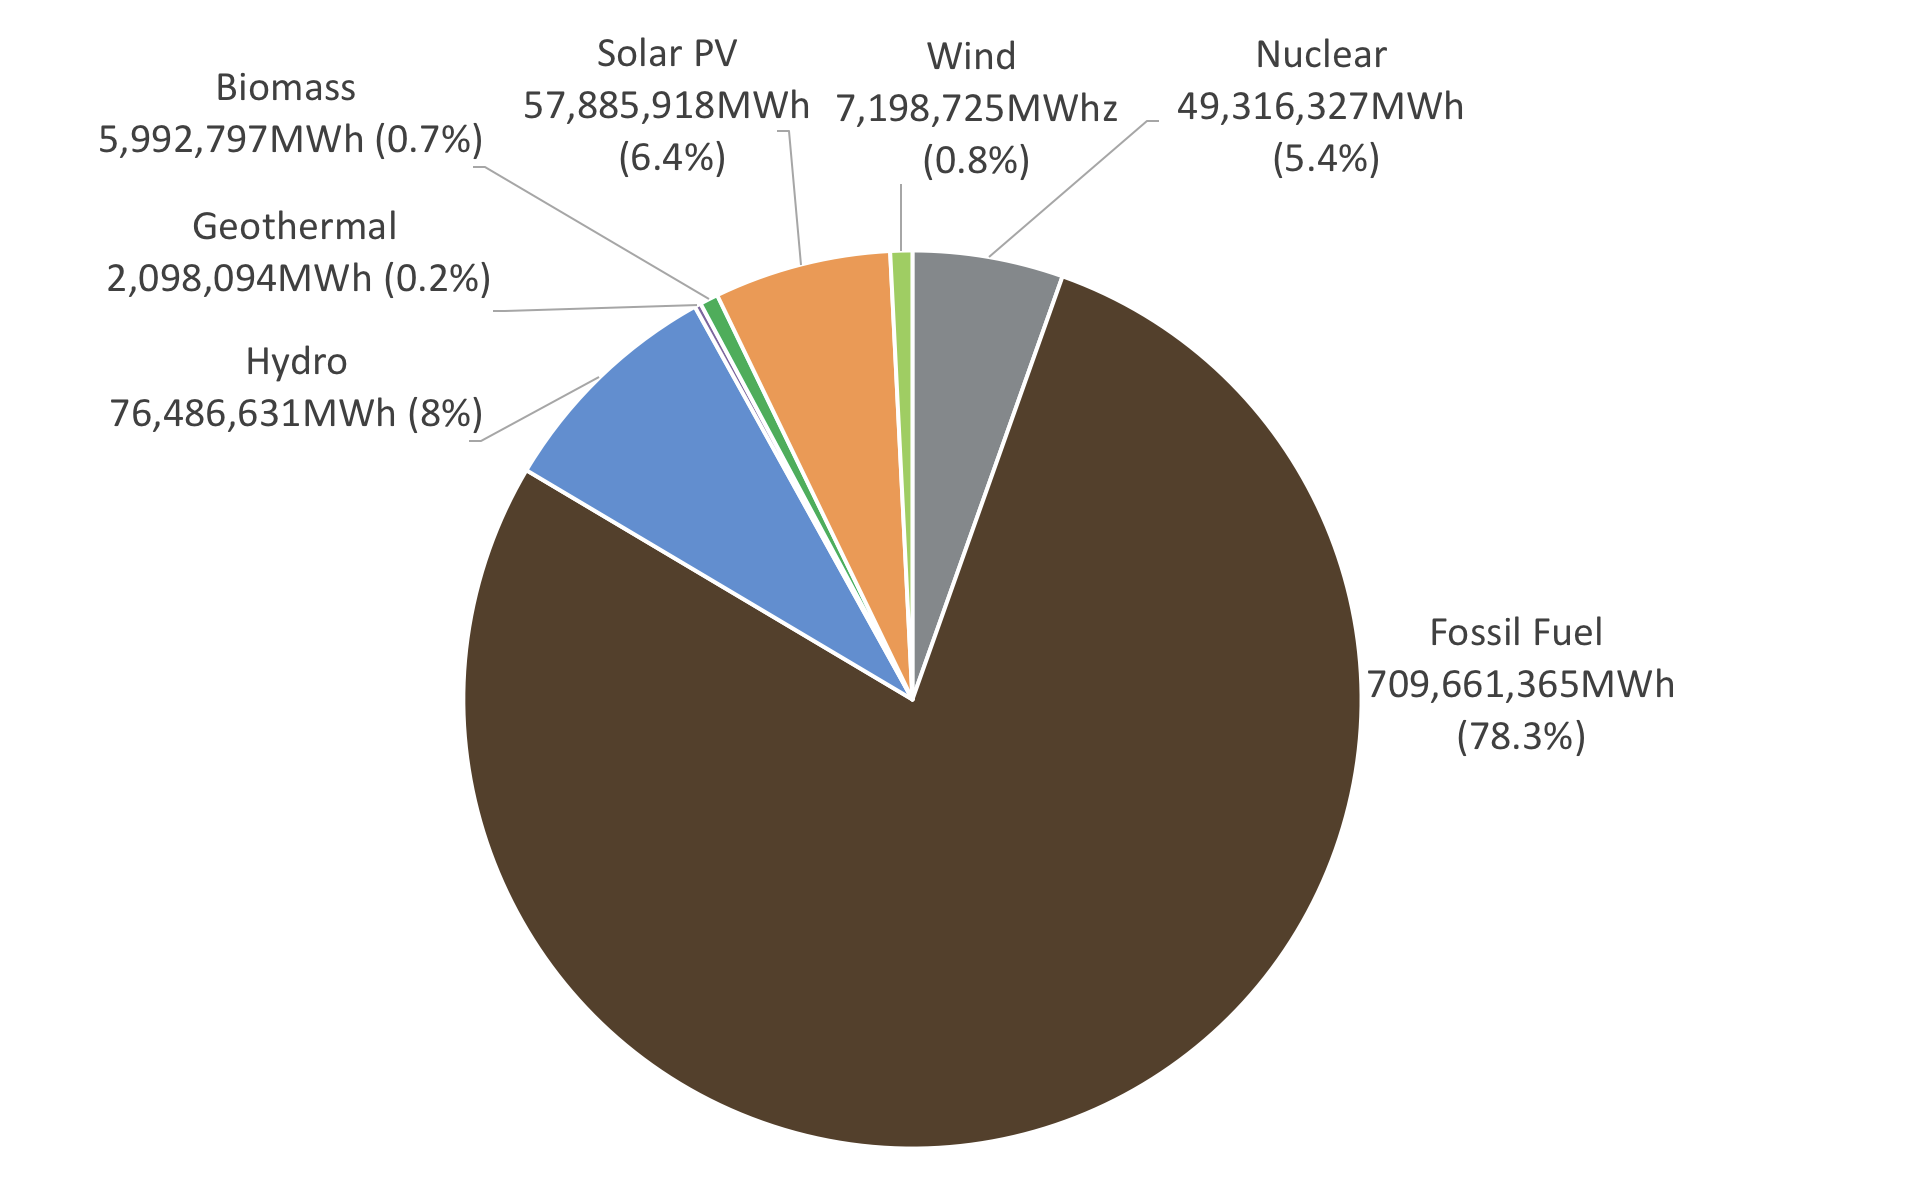
- The share of renewable energy in all power generation in 2018 is 16.5 %.
- There is 1.5% increase from the renewable energy share in 2017 (15%).
- The share of solar power generation is 6.4%, which is higher than that of nuclear power, 5.4%.
The data update to “Electricity Generation and Demand”, “Renewable Energy Share in Electricity” and “Data Search” graphs is scheduled around February 22nd (Fri). ISEP Energy Chart will mark its first anniversary soon. We appreciate your continued support and the use of this Energy Chart.