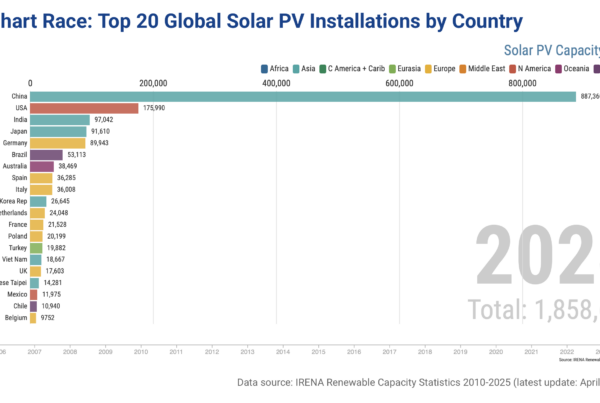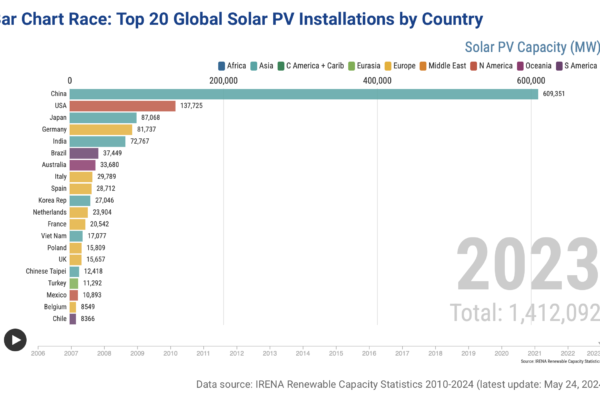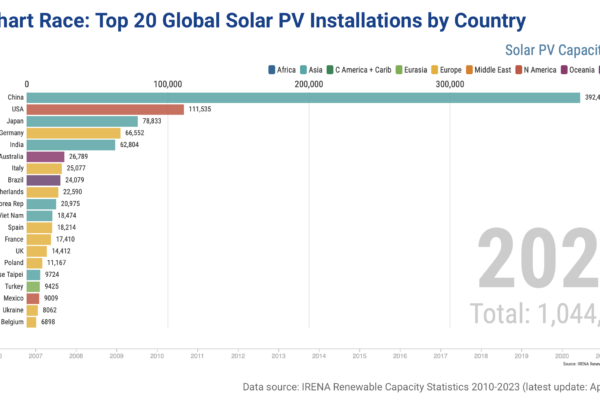
ISEP Energy Chart updated the data for each electric power company and across Japan from April to June,2018. Data can be found under “Electricity Generation and Demand”, “Renewable Energy Share in Electricity”, “Data Search” tags.
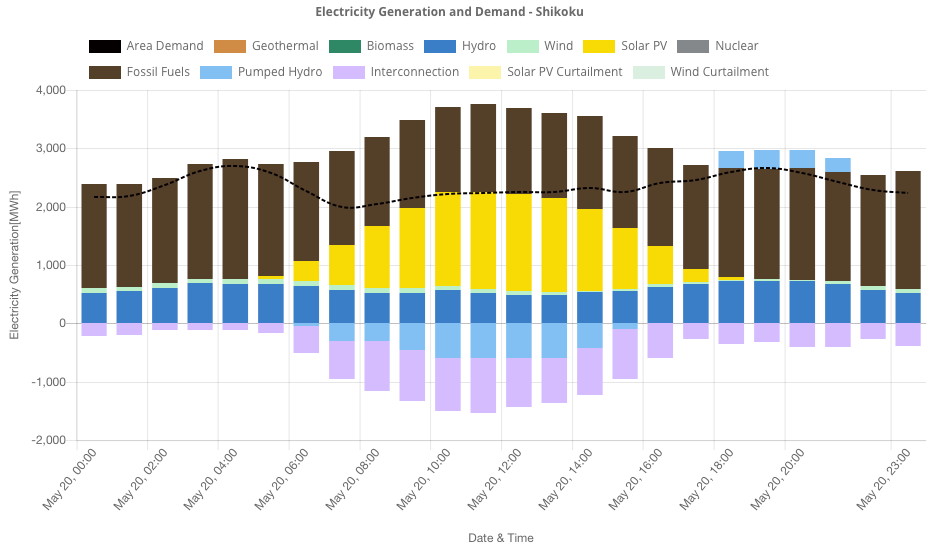
As the blog was released on 16th August, the graph of “Electricity Generation and Demand” and “Renewable Energy Share in Electricity” from 10a.m. to 12p.m. on May 20,2018 has shown the 100% renewable energy generation in Shikoku. The image above can be downloaded in “Electricity Generation and Demand” on 20th May published by Shikoku Electric Power Co., Ltd..
Also, the Excel format can also be downloaded, please feel free to utilize it.
Here is the maximum renewable energy (including hydro power) power ratio in hourly data from April to June of 2018. In addition, since you can check data excluding hydro power on “Data Search” page, please have a look.
| Area | Date | Time | Share[%] |
| Nationwide | 2018/5/5 | 12:00 | 62.0% |
| Hokkaido | 2018/4/29 | 10:00 | 70.2% |
| Tohoku | 2018/5/20 | 11:00 | 86.1% |
| Tokyo(TEPCO) | 2018/5/5 | 11:00 | 45.0% |
| Chubu | 2018/5/5 | 11:00 | 73.1% |
| Hokuriku | 2018/5/5 | 15:00 | 93.6% |
| Kansai | 2018/5/5 | 12:00 | 50.0% |
| Chugoku | 2018/5/20 | 11:00 | 79.8% |
| Shikoku | 2018/5/20 | 10:00 | 101.8% |
| Kyushu | 2018/5/3 | 12:00 | 96.1% |
| Okinawa | 2018/4/8 | 13:00 | 32.3% |
In addition, the maximum renewable energy power ratio (including hydro) per day reached 52.2%, which is more than half of the demand in Shikoku.
There will be comparison with the data from 2017 that will be posted on the blog.
ISEP has been doing various projects including Energy Chart. We are grateful for any donation to support more activities from ISEP.