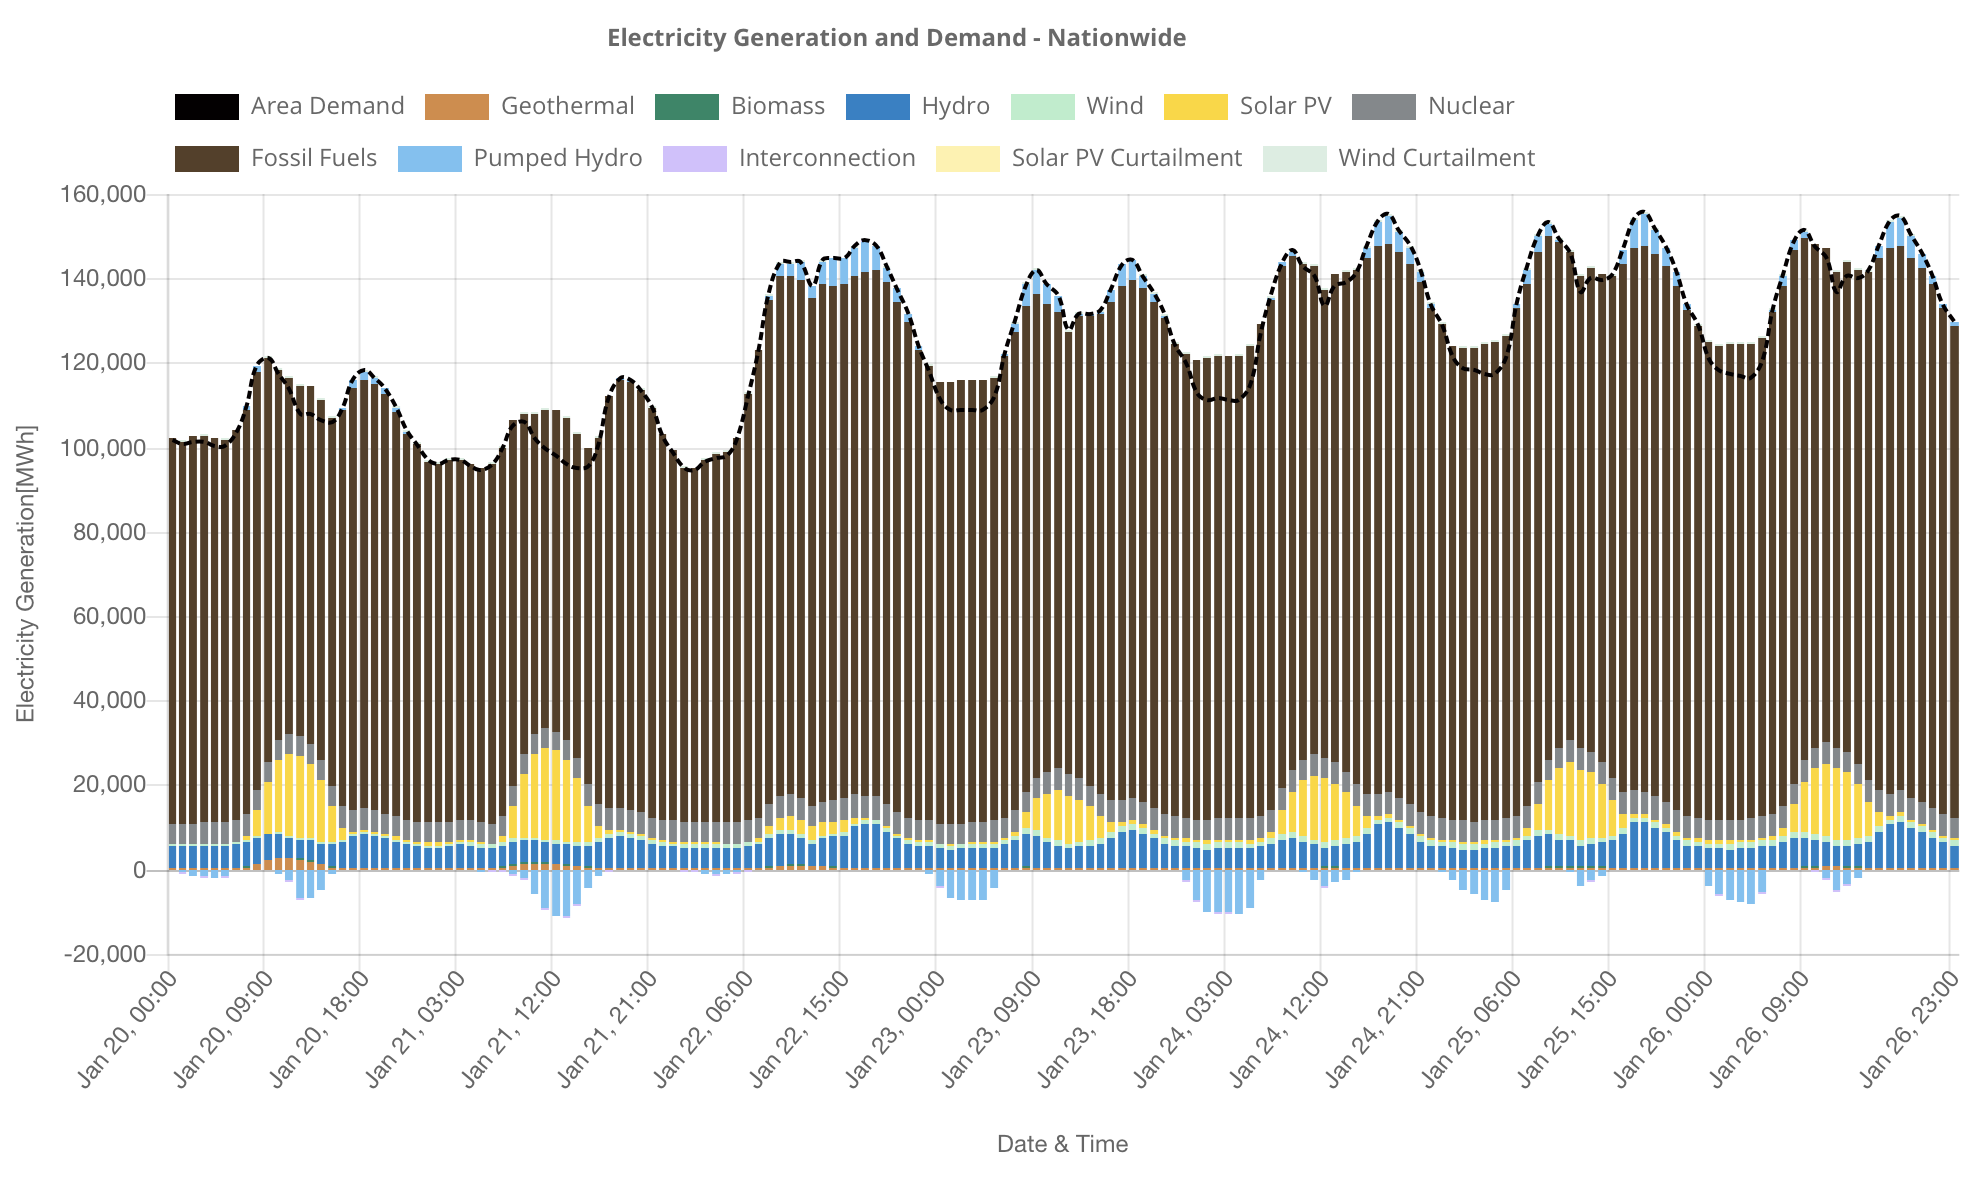
ISEP Energy Chart has updated data for each electric power company and across Japan from January to March 2018. “Electricity generation and demand” can now graph the solar PV generation and demand situation on January 22nd, 2018 when heavy snowfall happened in the TEPCO area.
Also, since the data for April 2017 to March 2018 is now ready, “Renewable Energy Share in Electricity” shows the generation ration in 2017, “Data Search” can check the maximum and minimum data in FY 2017.
Regarding the maximum amount of electricity generation with hourly data, there were many area showing the data of late-March. For example, the maximum amount of electricity generation for FY2017 in Japan as a whole was 44386 MWh at 11 on March 30, 2018.
We are going to update the date while comparing the figures from 2016.
ISEP conducts various projects including Energy Chart. I sincerely look forward to your donation to support related activities of ISEP.