ISEP Energy Chart
  • Home
  • Concept
  • Graph
    • Electricity Generation and Demand
    • Renewable Energy Share in Electricity
    • Cumulative Installed Capacity (Electricity)
    • Cumulative Installed Capacity (Heat)
    • Bar Chart Race (Solar PV)
    • Bar Chart Race (Wind)
  • Data Search
  • Blog
  • Donation
  • Contact
  • Japanese
Press enter to begin your search
CommentaryElectricity Generation and Demand

Heavy snow in TEPCO Area on January 22nd, 2018

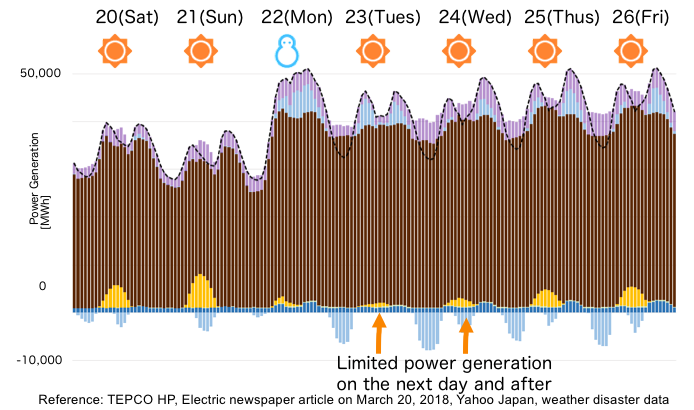
The snow in the metropolitan area significantly reduced solar power generation and the supply and…
ISEP Energy Chart2018-07-03
Event

The event report of “renewable energies of Japan and Germany and how to utilize data” on May 24th

I realized the difference between Japan and Germany in terms of renewable energy, the long-term…
ISEP Energy Chart2018-05-25
Data SearchData UpdateElectricity Generation and Demand

Questions in regards to review electricity generation and demand data for FY 2016

Regarding Electricity generation and demand data for FY 2016, Chubu Electric Power has upwardly modified…
ISEP Energy Chart2018-03-20
Data SearchData UpdateElectricity Generation and DemandRenewable Energy Share in Electricity

Updating data from October to December 2017

Since we updated the data of each electric power company from October to December 2017,…
ISEP Energy Chart2018-03-16
Electricity Generation and Demand

Is it simple to create graph of electricity generation and demand?

It is not that difficult to manage this task if you have some knowledge of…
ISEP Energy Chart2018-03-06
Previous 1 … 3 4 5 6 7 Next

Categories

  • About ISEP Energy Chart
  • Bar Chart Race
  • Commentary
  • Cumulative Installed Capacity
  • Data Search
  • Data Update
  • Electricity Generation and Demand
  • Event
  • News
  • Renewable Energy Share in Electricity

Archives

  • April 2025
  • May 2024
  • April 2023
  • December 2022
  • October 2022
  • April 2022
  • July 2021
  • May 2019
  • February 2019
  • December 2018
  • October 2018
  • August 2018
  • July 2018
  • May 2018
  • March 2018
  • February 2018

About the ISEP Energy Chart

ISEP Energy Chart is an energy data visualization project conducted by ISEP. Interpret the rapid development of renewable energies through data analysis.

Donation

Your donation helps our continuous operation and expansion of the website.

Recent Posts

  • Global Solar and Wind Bar Chart Races 2024 Data Added 2025-04-17
  • Global Solar and Wind Bar Chart Races 2023 Data Added 2024-05-24
  • Global Solar and Wind Bar Chart Races 2022 Data Added 2023-04-04
  • August – September 2022 Data Update 2022-12-06

Copyright 2018 Institute for Sustainable Energy Policies. All rights reserved.

  • Home
  • Concept
  • Graph
    • Electricity Generation and Demand
    • Renewable Energy Share in Electricity
    • Cumulative Installed Capacity (Electricity)
    • Cumulative Installed Capacity (Heat)
    • Bar Chart Race (Solar PV)
    • Bar Chart Race (Wind)
  • Data Search
  • Blog
  • Donation
  • Contact
  • Japanese