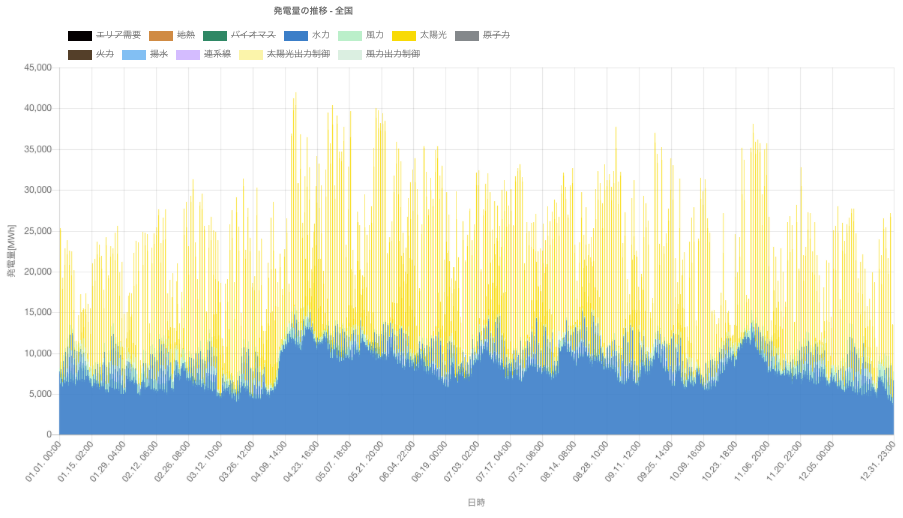
全国 2017年1月1日〜12月31日
Since we updated the data of each electric power company from October to December 2017, it is now shown in the data of Electricity generation and Demand, Renewable Energy Share in Electricity and Data Search.
What changed in particular was the minimum renewable energy electricity of 2017 of “Data Search”. There were many areas where the values of the daily data of the minimum renewable energy electricity and weekly data became the values from October to December. On the other hand, in hourly data, there were places that showed lower values even in Spring and Summer. Hydropwer generate more in Spring and Summer in general and often less in Winter. Therefore its effect seems to be big.
If you are interested, please select 12 months from January 1st, 2017 in the trend of the amount of power generation and demand as shown above. Then please try to leave hydro power, wind power, solar PV etc. from the legend part; you can choose to show or hide each power sources by clicking the legend button. Since regional diffeences are large, it is quite fun to compare the data. It seems that Okinawa Electric Power has few hydroelectric power generation.
In addition, since the data for 2016 was also revised at Chubu Electric Power and Tokyo Electric Power Co., we will talk about that in the next blog.


