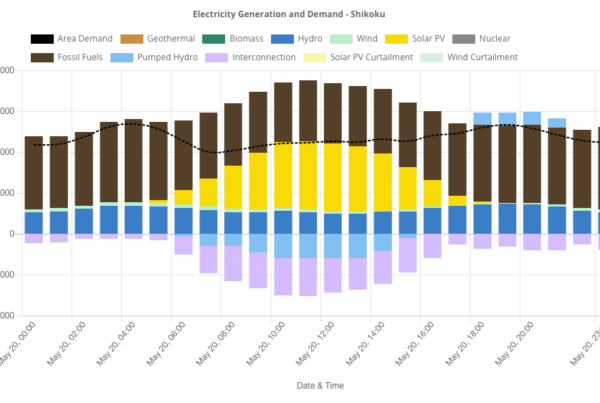
It is not that difficult to manage this task if you have some knowledge of Excel and energy. To be honest, it is slightly uneasy if there is only one person working on this project. Therefore, we decided to have two people work at the same time and check any errors.
To put it simply, you can download data from the websites of general electric utilities, rearrange data in Excel.
For students and researchers who might be interested in visualizing energy data with Excel by yourself, please be aware of the following points.
- Please pay attention to Tokyo electric power company and Shikoku electric power company because they use different unit for electricity data.
- Please pay attention to Tohoku Electric Power Co. because the company has different order of power generation sources.
- Pay attention to Okinawa Electric Power Co. because the company does not have data reagarding nuclear power, geothermal power, plumped hydro, and interconnection line.
- Ways to produce data for renewal period differs for each company. This time, there are items that can be downloaded independently from October 2017 to December 2017, which is integreated with data from April 2017, etc. Take out data so as not to make a mistake; personally, it is easier if you only have updated parts.
- Pay atttention to the notations of the date and time which is different for each company.
Although it all seems like a small thing, it is advisable to students and researchers to comment on the data in order to centralize information. In this way, the data can be easily created without any misatakes.


