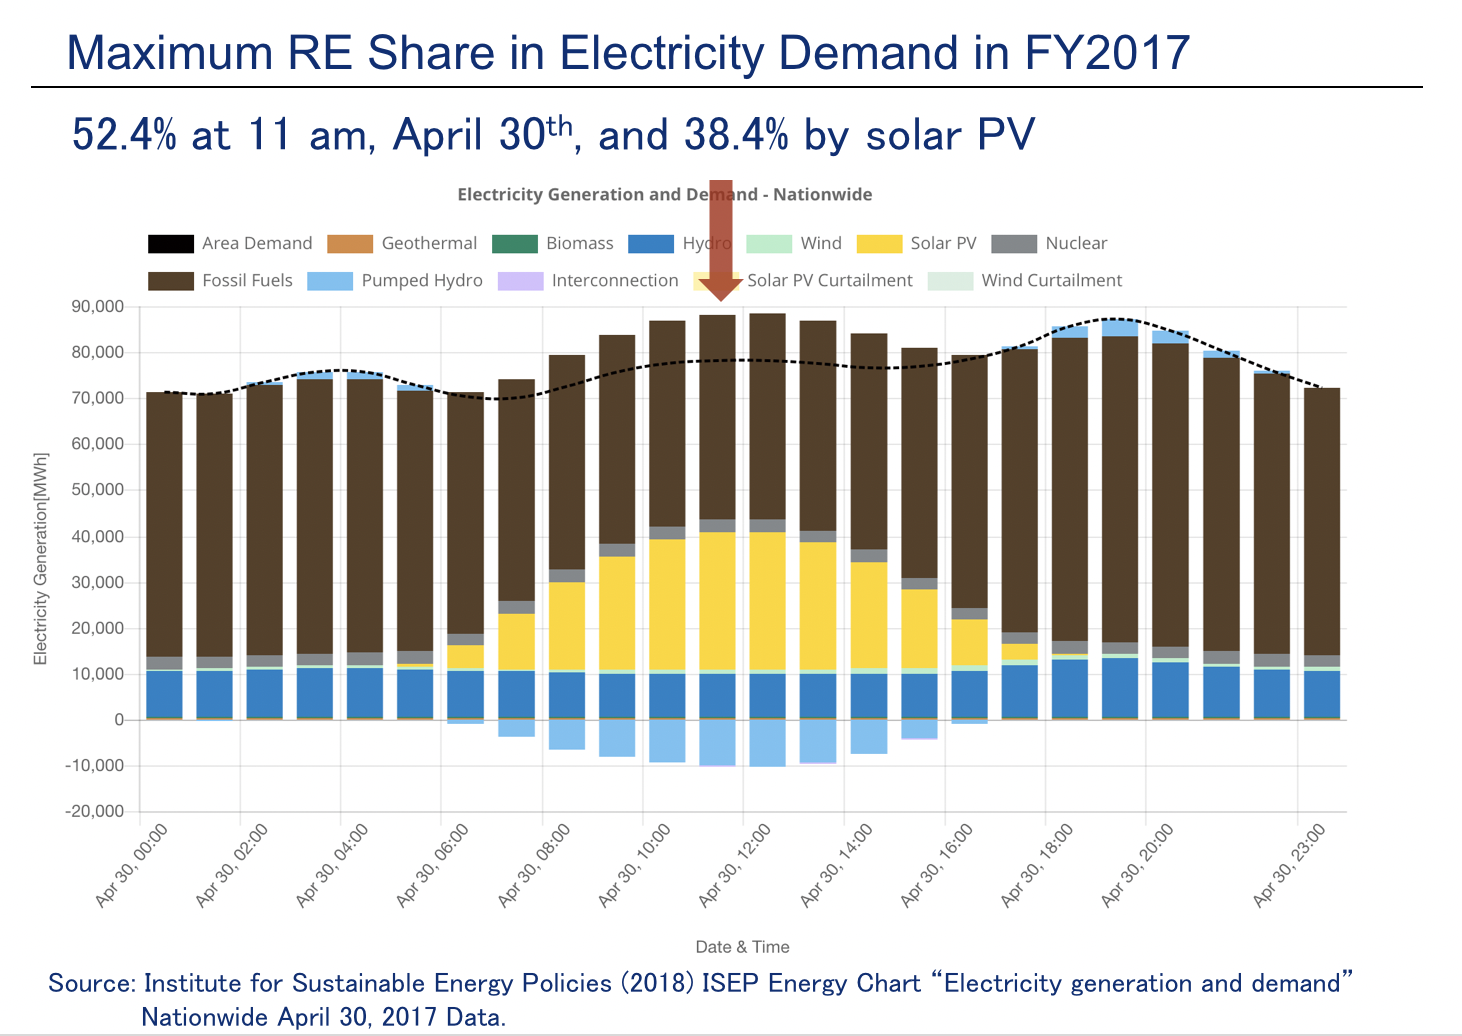
Please specify the source when citing data or graphs from the ISEP Energy Chart. The figure above shows an example of a citation for powerpoint usage.
Example from the above figure
Source: Institute for Sustainable Energy Policies (2018) ISEP Energy Chart “Electricity generation and demand” Nationwide April 30, 2017 Data.
Additionally, feel free to modify/alter or combine graphs together (modifications that give a false impression of reality will not be tolerated).
However, in such cases where graphs are altered and published with the modifier cited, they must accept that these altered graphs can be used and modified by a third party.
In all cases, the use of graphs for both commercial and non-commercial purposes is permitted.
As outlined in the “Concept” page, third party usage must conform to the “Creative Commons Attribution-ShareAlike 4.0 International License“.
Please publicise anything interesting you find from the data or graphs that we have not outlined.
Lastly, in order to continue developing the ISEP Energy Chart website, please consider donating.