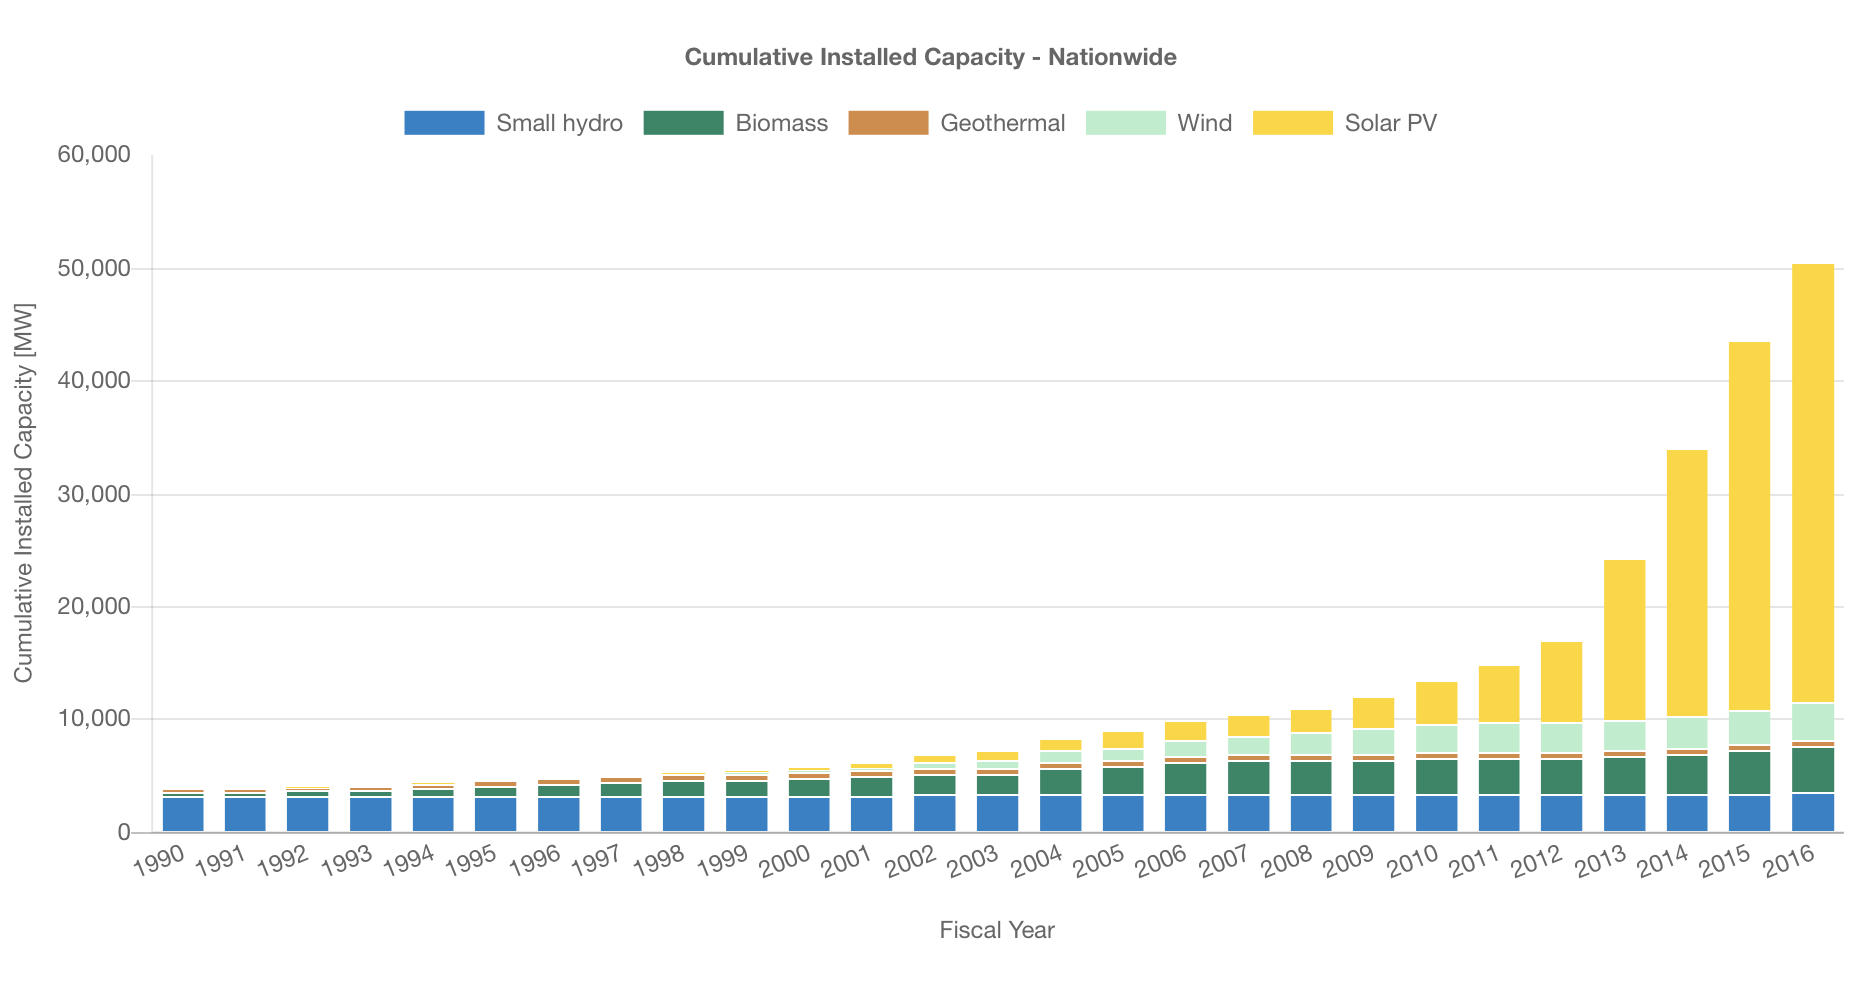
約13倍!
1990〜2016年度 全国 自然エネルギー累積設備導入量
In the ISEP Energy Chart “Cumulative Installed Capacity” graph, you can view the installed renewable energy generation capacity from 1990 to 2016[1].
After the introduction of Feed-in Tariffs (FITs) in 2012, newly installed facilities have been for the most part photovoltaic (PV) solar power. As a result, during this period, renewable energy generation has seen an increase of 13 times, from 3,846MW to 50,540MW.
PV capacity from 1990 to 2011 saw an average increase of 7% annually. After the introduction of FiTs in 2012, the average annual increase rose to 52%.People have suggested that this extreme increase has been due to solar PV taking less time to produce and having lower price point.
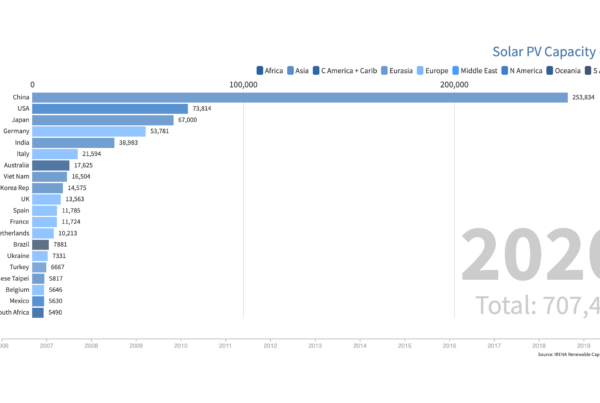
From 1990 to 2016, solar PV capacity has seen an increase of approximately 1200 times, increasing from 32MW to 39,089MW. During the first 5 years of the 21st century, Japan boasted the greatest installed capacity of solar PV in the world. However looking back now, it represented merely a small fraction of power produced. Despite the tremendous worldwide trend in the decreasing price of PV solar cells, grid constrains and the auction systems becoming large issues in Japan. There is still plenty of potential for the PV solar industry to continue to grow in Japan.
[1] The electricity generation by large hydro power plants more than 10 MW, approximately 47,000MW, is shown on graphs of “Electricity generation and demand” and “RE share.”