ISEP Energy Chart
  • Home
  • Concept
  • Graph
    • Electricity Generation and Demand
    • Renewable Energy Share in Electricity
    • Cumulative Installed Capacity (Electricity)
    • Cumulative Installed Capacity (Heat)
    • Bar Chart Race (Solar PV)
    • Bar Chart Race (Wind)
  • Data Search
  • Blog
  • Donation
  • Contact
  • Japanese
Press enter to begin your search
NewsRenewable Energy Share in Electricity

What is the ratio of renewable energy in 2018?

The energy demand and supply data until December 2018 has been released. In view of…
ISEP Energy Chart2019-02-07
About ISEP Energy ChartData UpdateElectricity Generation and DemandRenewable Energy Share in Electricity

Mistake in the nationwide data from January to March, 2018 (apology)

There was a mistake in data concerning the “Electricity Generation and Demand – Nationwide”, “Renewable…
ISEP Energy Chart2019-02-05
CommentaryNews

OCCTO has started to publish electricity demand data and graphs

Based on the supply data for October 2018, the Organization for Cross-regional Coordination of Transmission…
ISEP Energy Chart2018-12-12
About ISEP Energy Chart

Information exchange with Agora Energiewende Part 3 – Advice on the ISEP Energy Chart

We will make annual reports and revise website based on the advice by Agora Energiewende.
ISEP Energy Chart2018-10-25
About ISEP Energy Chart

Information exchange with Agora Energiewende Part 2 – Characteristics of the Agorameter

The main contributions of Agorameter are to create demand for data visualization, to let public…
ISEP Energy Chart2018-10-23
Previous 1 2 3 4 … 6 Next

Categories

  • About ISEP Energy Chart
  • Bar Chart Race
  • Commentary
  • Cumulative Installed Capacity
  • Data Search
  • Data Update
  • Electricity Generation and Demand
  • Event
  • News
  • Renewable Energy Share in Electricity

Archives

  • December 2022
  • October 2022
  • April 2022
  • July 2021
  • May 2019
  • February 2019
  • December 2018
  • October 2018
  • August 2018
  • July 2018
  • May 2018
  • March 2018
  • February 2018

About the ISEP Energy Chart

ISEP Energy Chart is an energy data visualization project conducted by ISEP. Interpret the rapid development of renewable energies through data analysis.

Donation

Your donation helps our continuous operation and expansion of the website.

Recent Posts

  • August – September 2022 Data Update 2022-12-06
  • Until July 2022 Data Update 2022-10-25
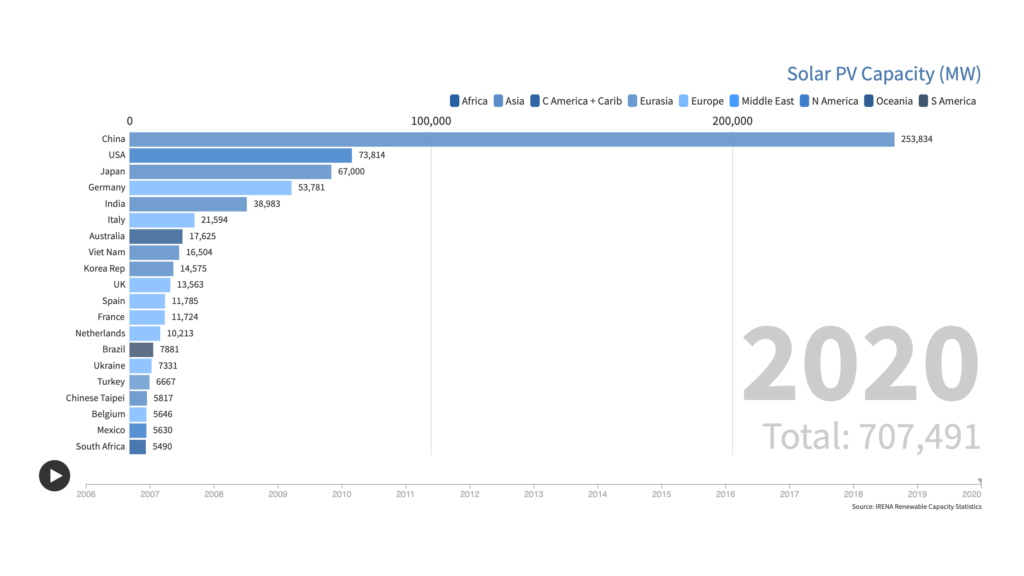
  • Global Solar and Wind Bar Chart Races 2021 Data Added
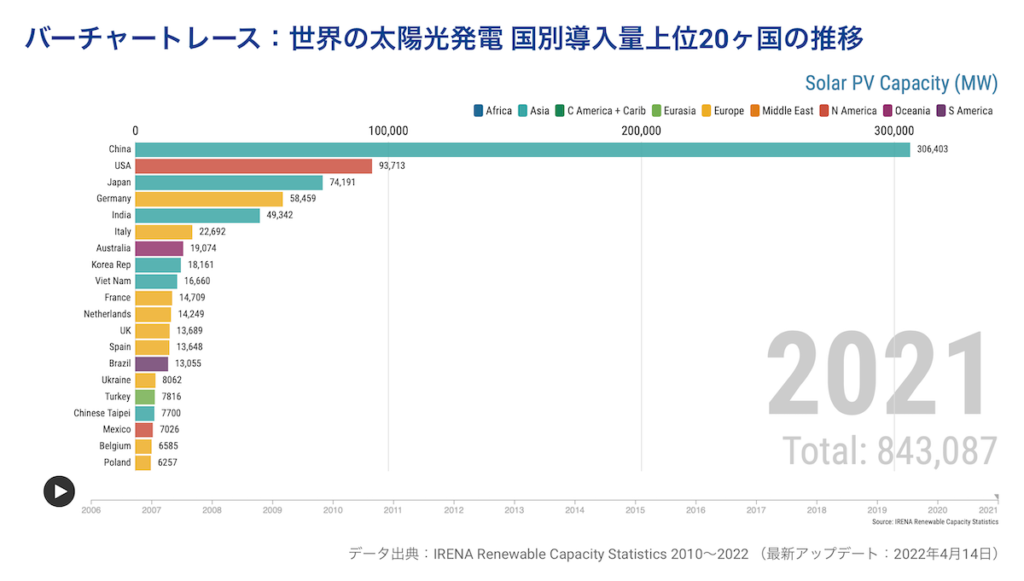
 2022-04-15
  • Global Solar and Wind Bar Chart Races Added 2021-07-06

Copyright 2018 Institute for Sustainable Energy Policies. All rights reserved.

  • Home
  • Concept
  • Graph
    • Electricity Generation and Demand
    • Renewable Energy Share in Electricity
    • Cumulative Installed Capacity (Electricity)
    • Cumulative Installed Capacity (Heat)
    • Bar Chart Race (Solar PV)
    • Bar Chart Race (Wind)
  • Data Search
  • Blog
  • Donation
  • Contact
  • Japanese