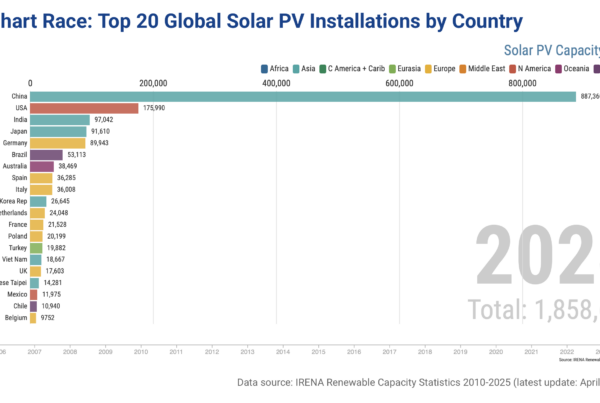
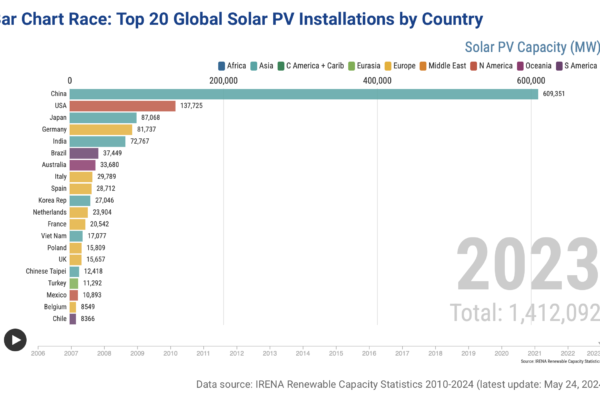
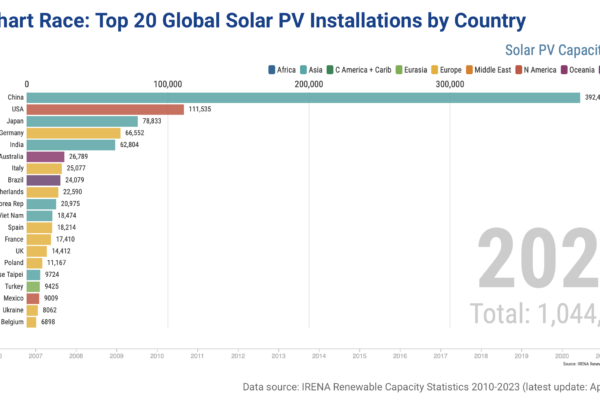
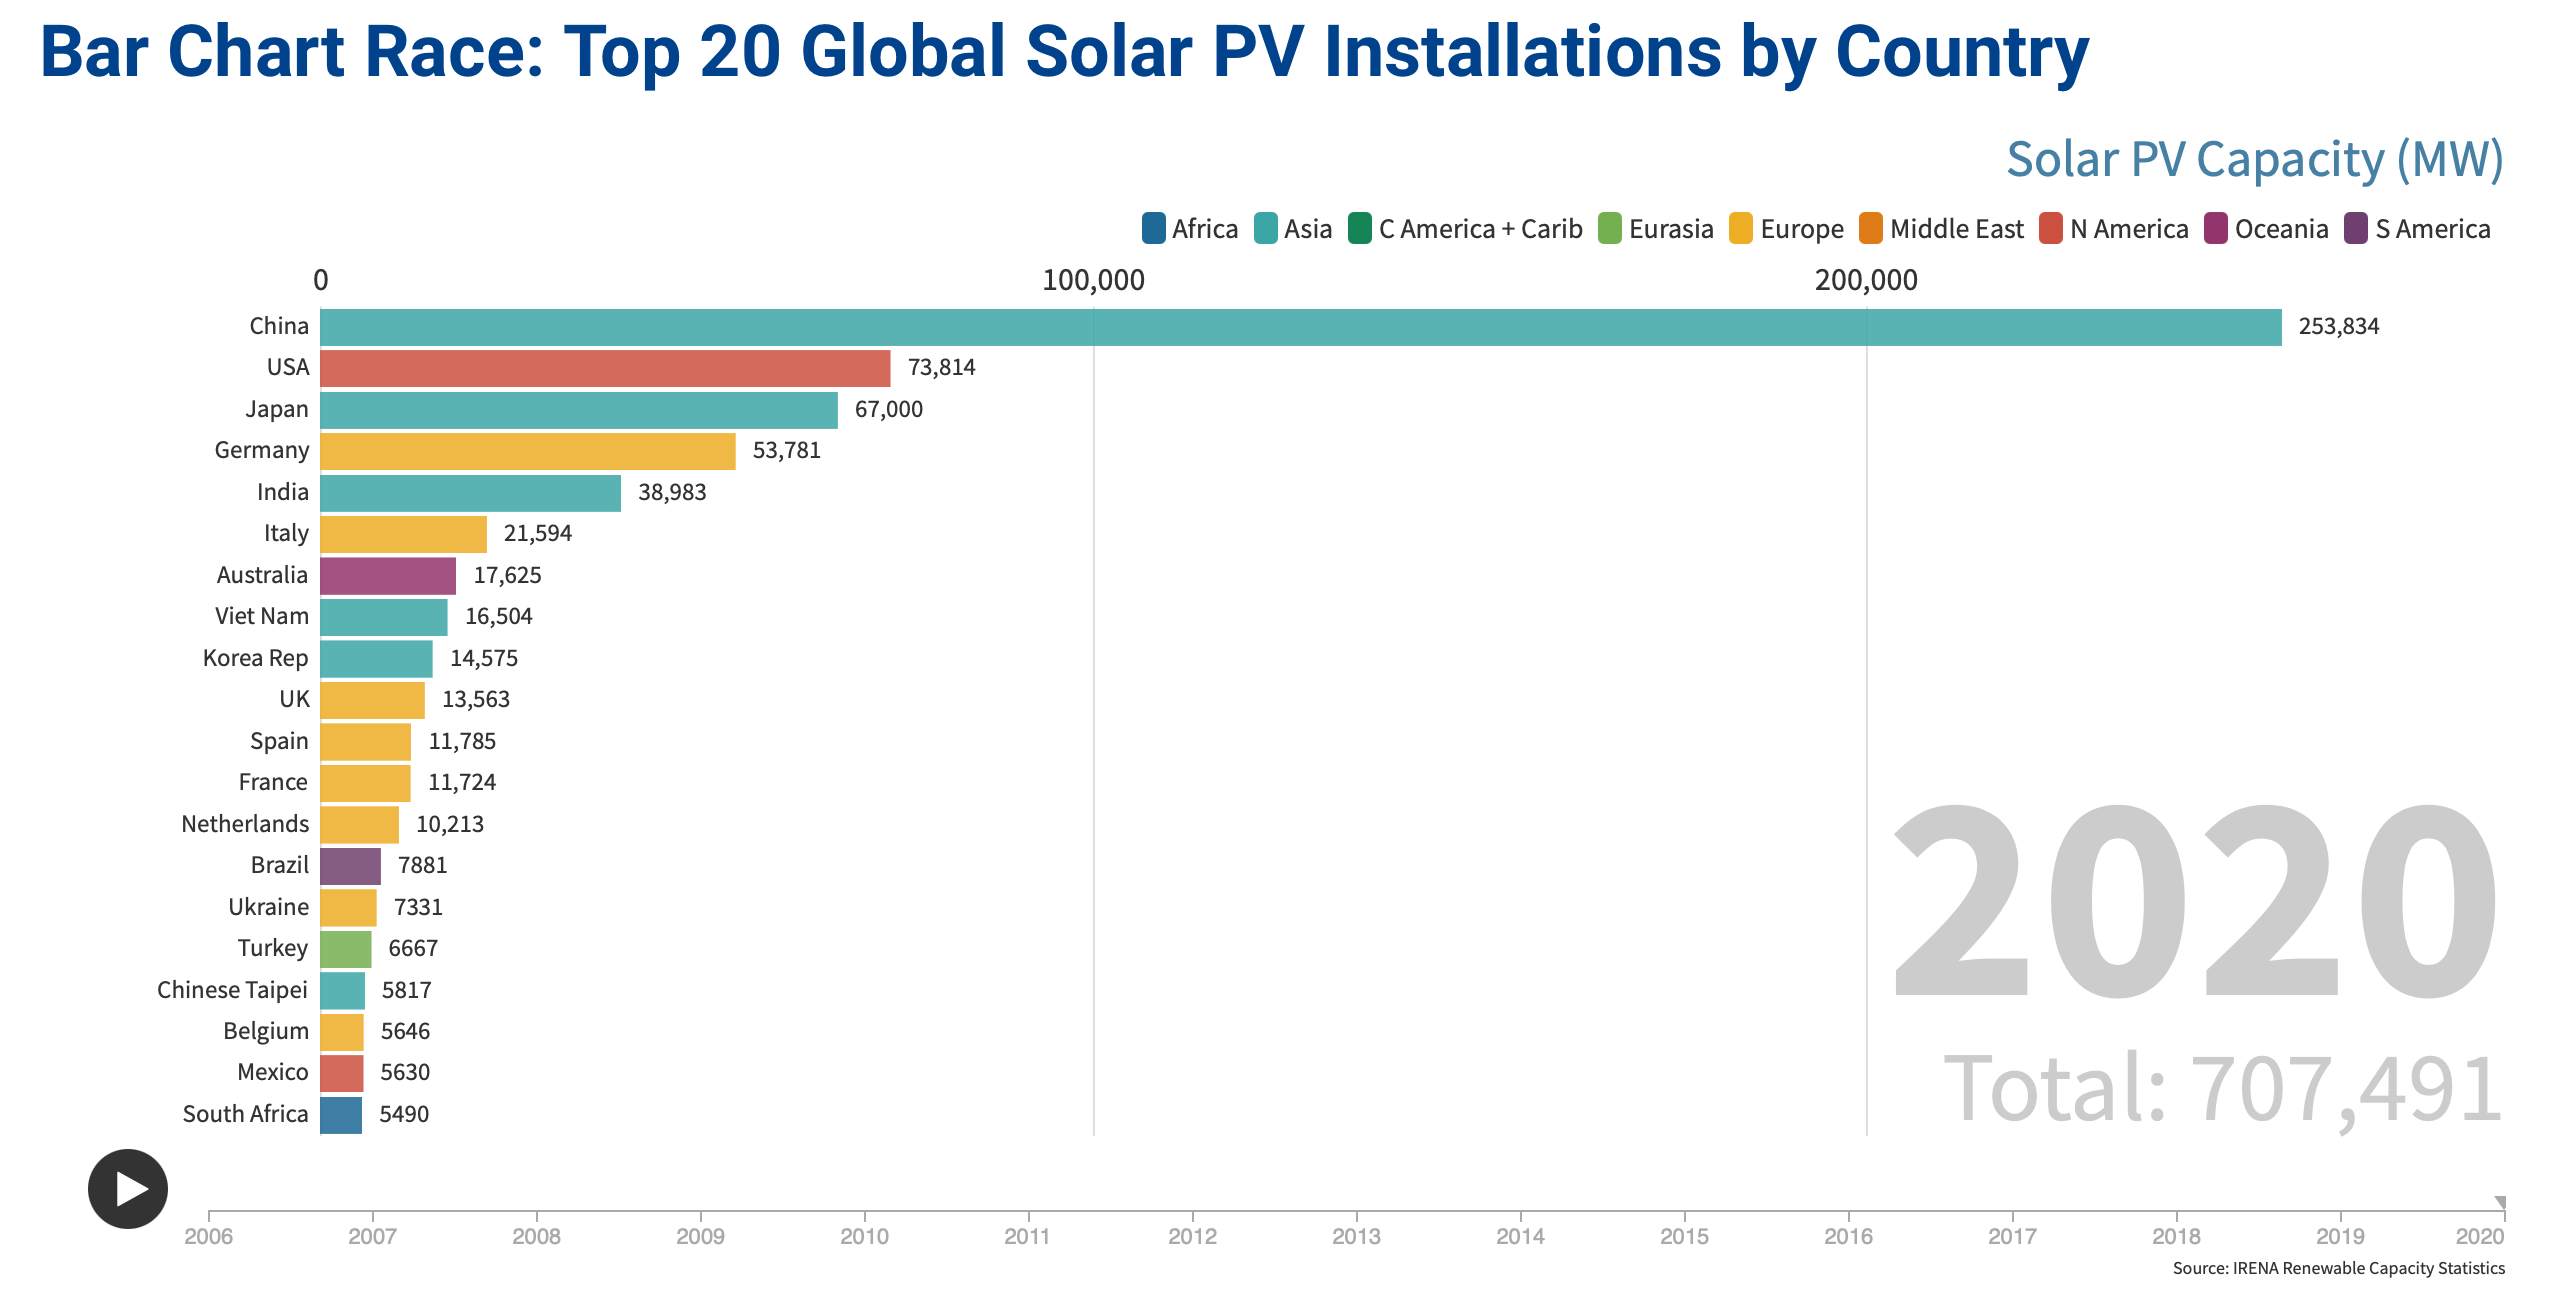
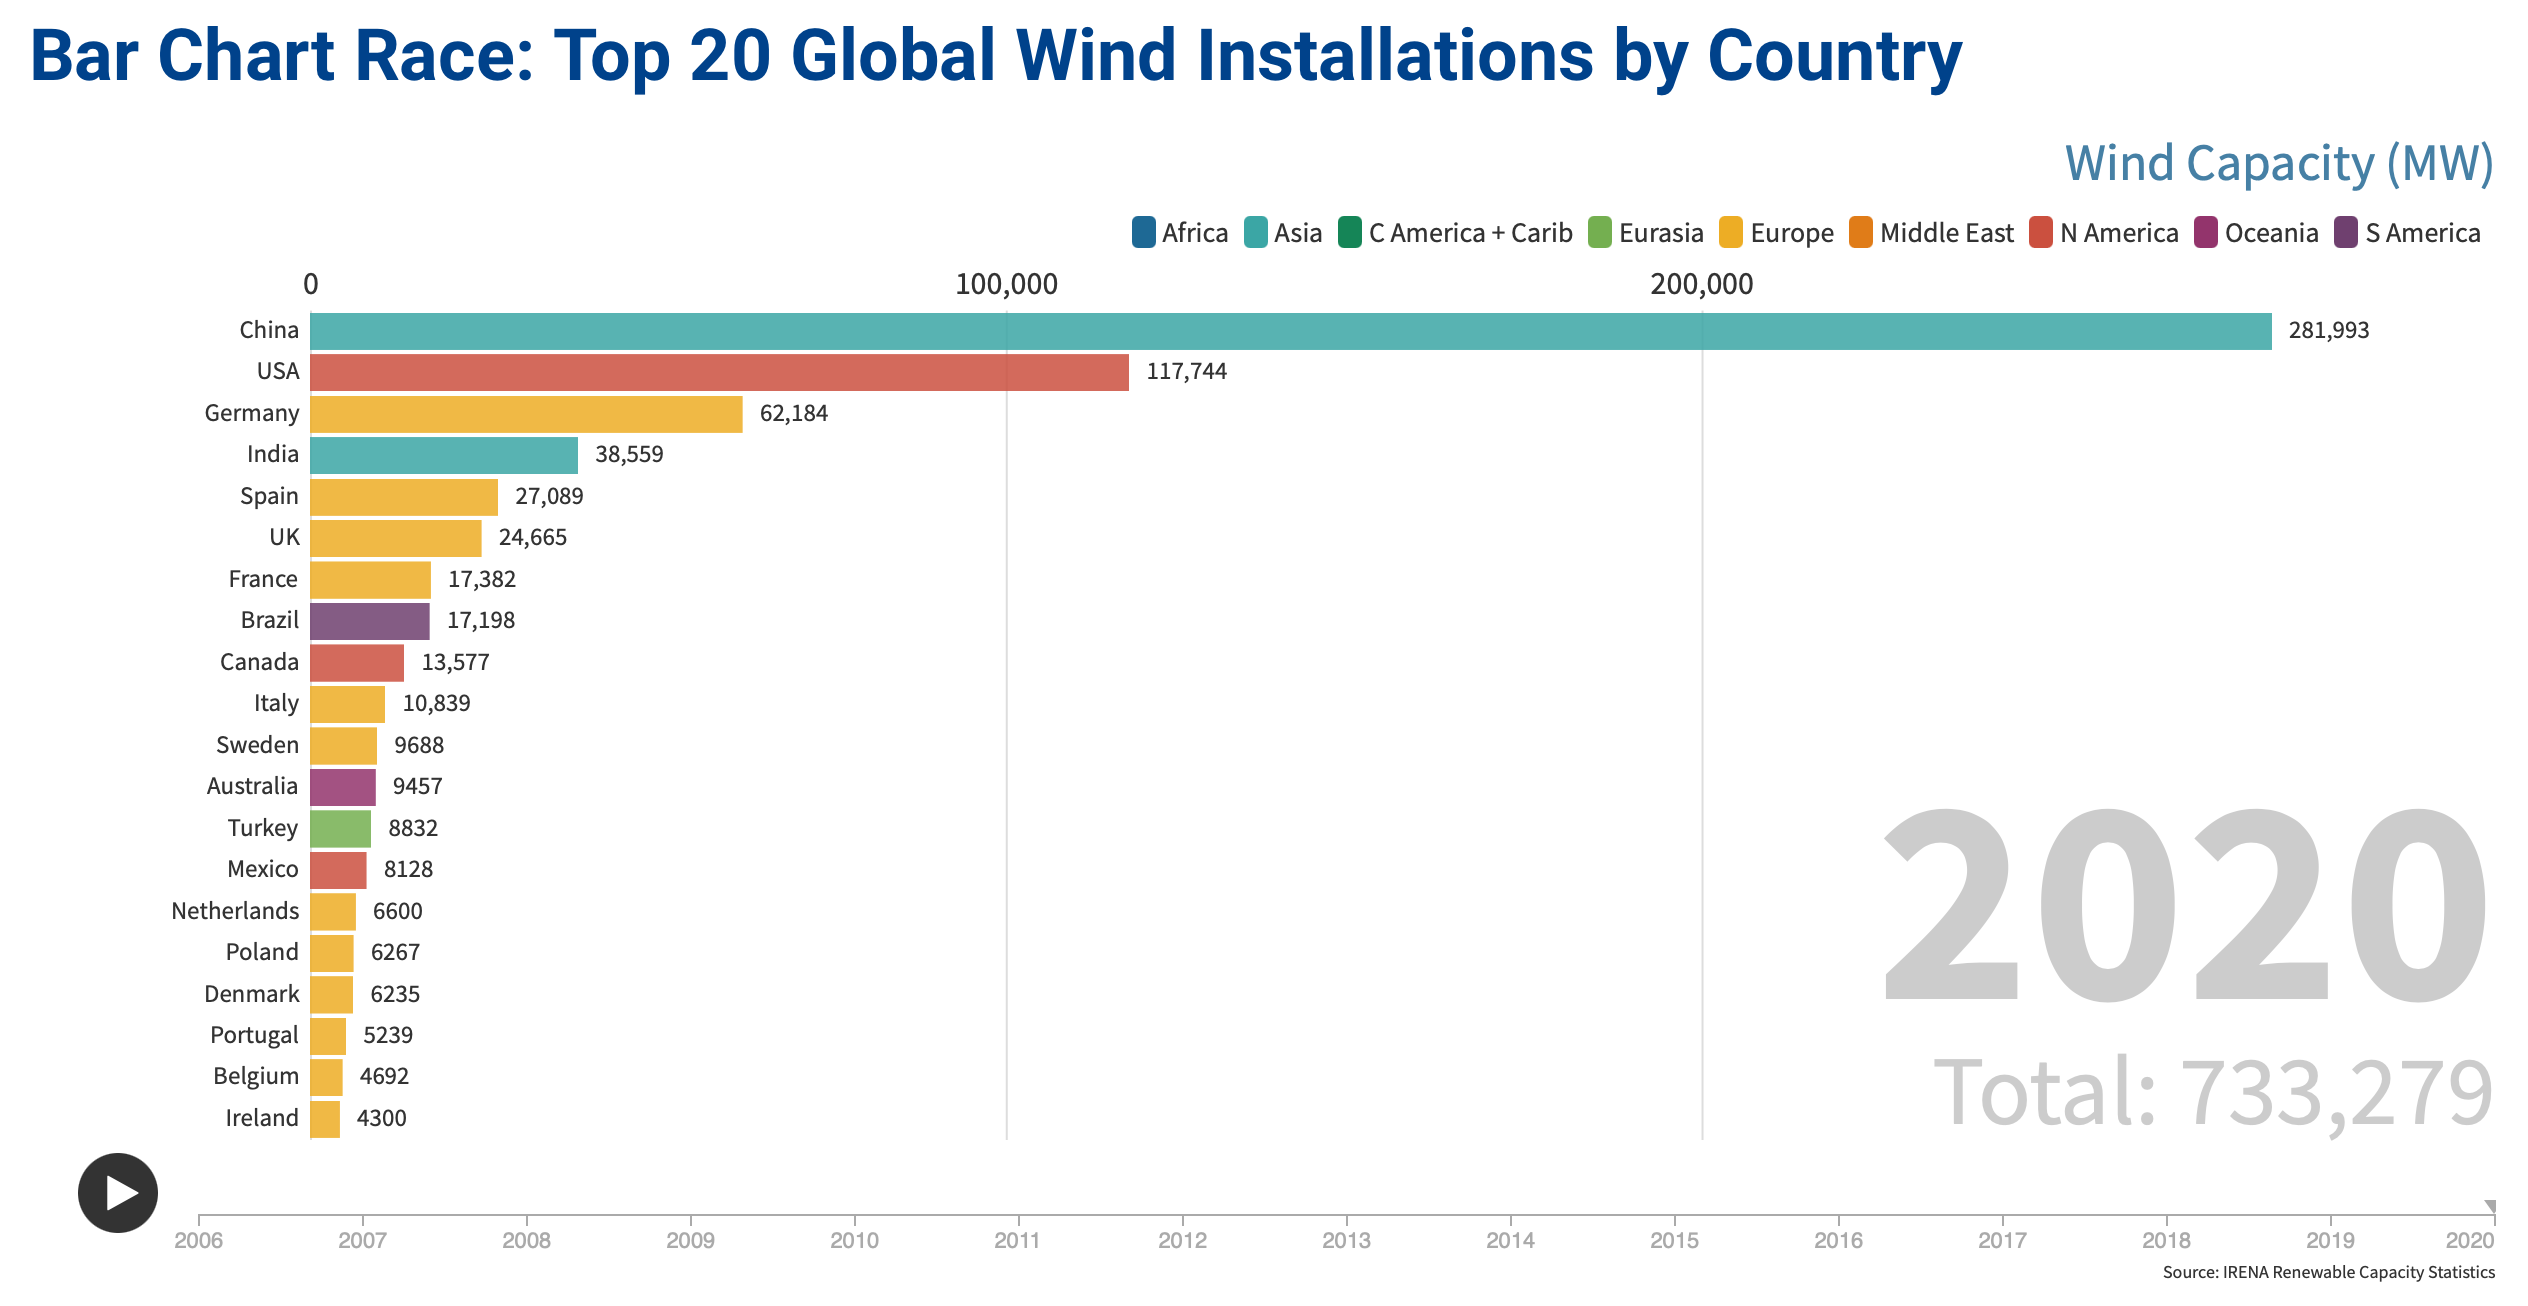
ISEP Energy Chart has added new bar chart races in global solar PV and wind power. You can see the transition of the top 20 countries in Solar PV and wind, and the transition of the global installations by regions.
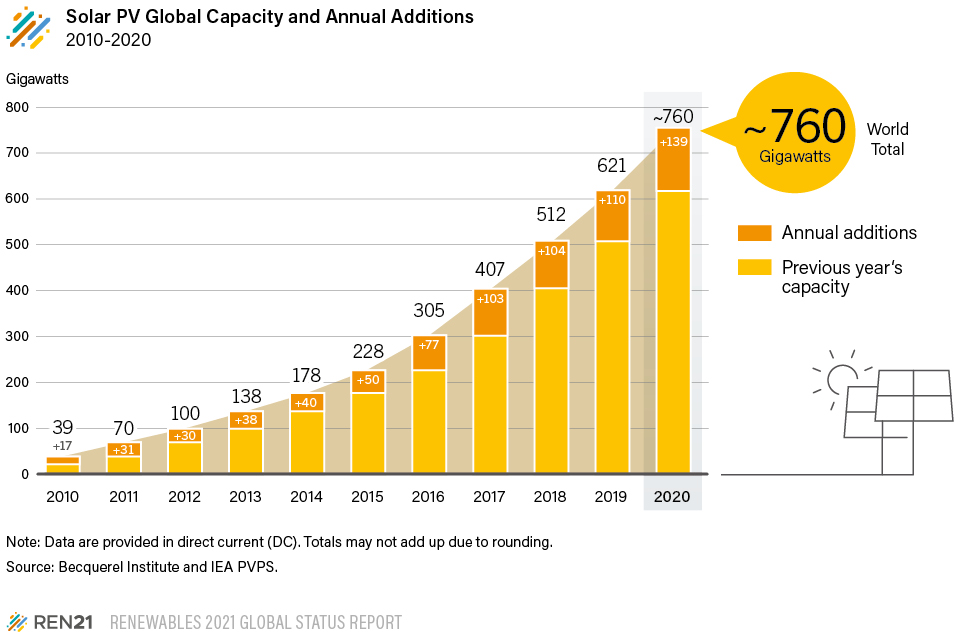
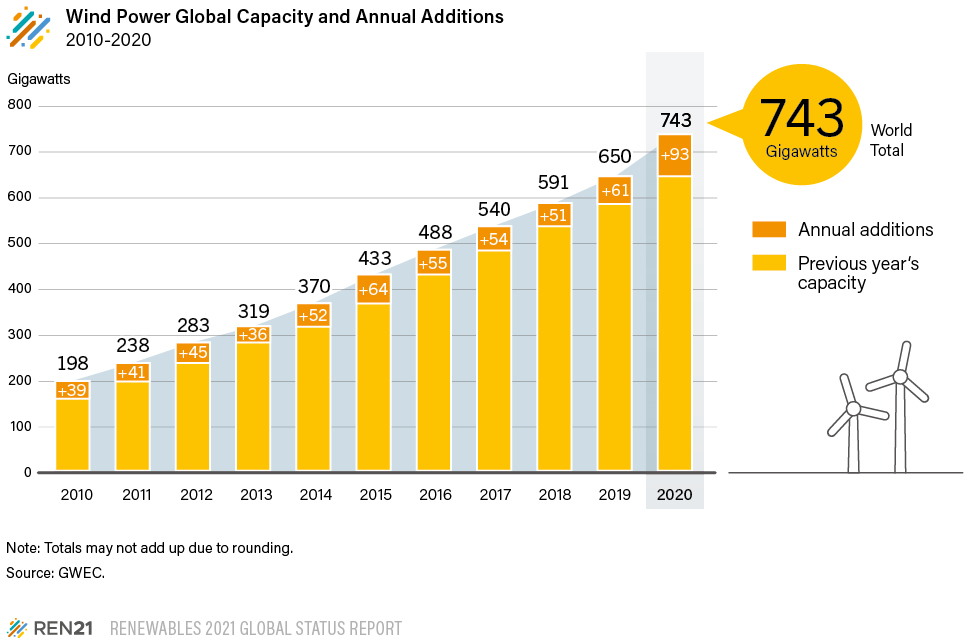
By 2020, the cumulative installed capacity of solar PV and wind were 760 GW and 743 GW, respectively, and the installed capacity of solar power and wind power in 2020 alone were 139 GW and 93 GW, respectively. (REN21 “Renewables 2021 Global Status Report“)
In order to understand the expansion of the introduction of renewable energies that is currently underway, it is important to understand the spatial and temporal path that it has taken, so that we can better understand the contexts of the energy transition.
Bar Chart Race is a method of data visualization that allows us to dynamically view data recorded in multiple categories in a time series, allowing us to clearly understand in which countries and regions the introduction of renewables has historically unfolded. It also provides important insights for deciphering the geopolitics of renewables, which has been the subject of active debate in recent years.
Considering the above, ISEP Energy Chart provides the bar chart races of the global solar PV and wind using data from IRENA Renewable Capacity Statistics, an annual renewable energy data statistic published by the International Renewable Energy Agency. (Data will be updated annually.)
ISEP Energy Chart will continue to visualize the data in order to interpret the rapid development of renewable energies through data analysis
—
Data Visualization by Shota Furuya
Data Source: IRENA Renewable Capacity Statistics
Visualization Tool: Flourish