2016年5月4日 全国 電力需要に占める自然エネルギーの電源構成
In the “RE shares in electricity demand or production” section of the ISEP Energy Chart, the graph of the composition of electricity of the selected power provision region can be viewed[1].
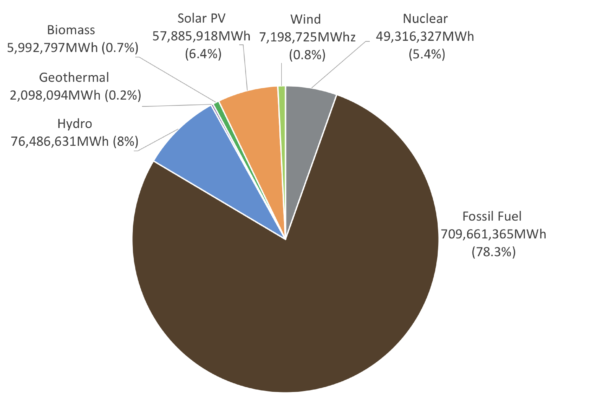
This time we will be looking at the renewable energy share data in the fiscal year 2016.
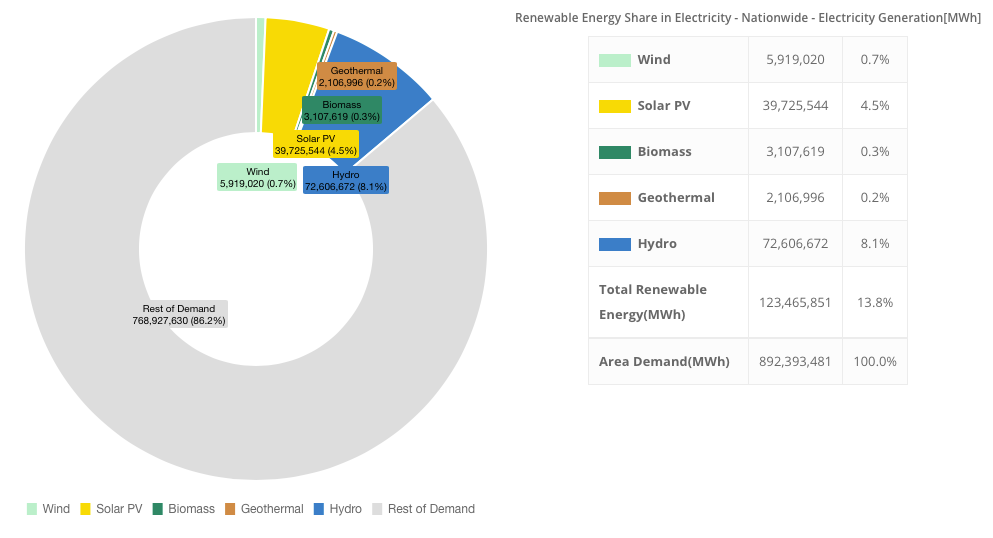
The figure shows the RE share graph of the entire country (including Hydro) at its maximum output on the 4th of May. The share of renewable energy was 27.4%. Within this, hydro power accounted for 15.6% and solar PV made up 9.5% (excluding self-consumption).
As with the country as whole, the Hokuriku regional grid reached its maximum share of renewable energy of 61.7% on the 4th of May, with hydro power accounting for 80% of renewable energy generated.
If we were to exclude hyrdo, the date with the highest share of renewable energy would be on the 27th of March 2017 in Kyushu regional grid at 24.2%, with solar PV showing a large prescence, accounting for 9.8% of renewable energy generated.
Please feel free to change the region and time frame to compare the differences between the renewable energy share.
[1] During the time this was written (January 2018), only data from April 2016 to Septemper 2017 has been released, thus only data from this time period can be displayed.


