ISEP Energy Chart
  • Home
  • Concept
  • Graph
    • Electricity Generation and Demand
    • Renewable Energy Share in Electricity
    • Cumulative Installed Capacity (Electricity)
    • Cumulative Installed Capacity (Heat)
    • Bar Chart Race (Solar PV)
    • Bar Chart Race (Wind)
  • Data Search
  • Blog
  • Donation
  • Contact
  • Japanese
Press enter to begin your search
Event

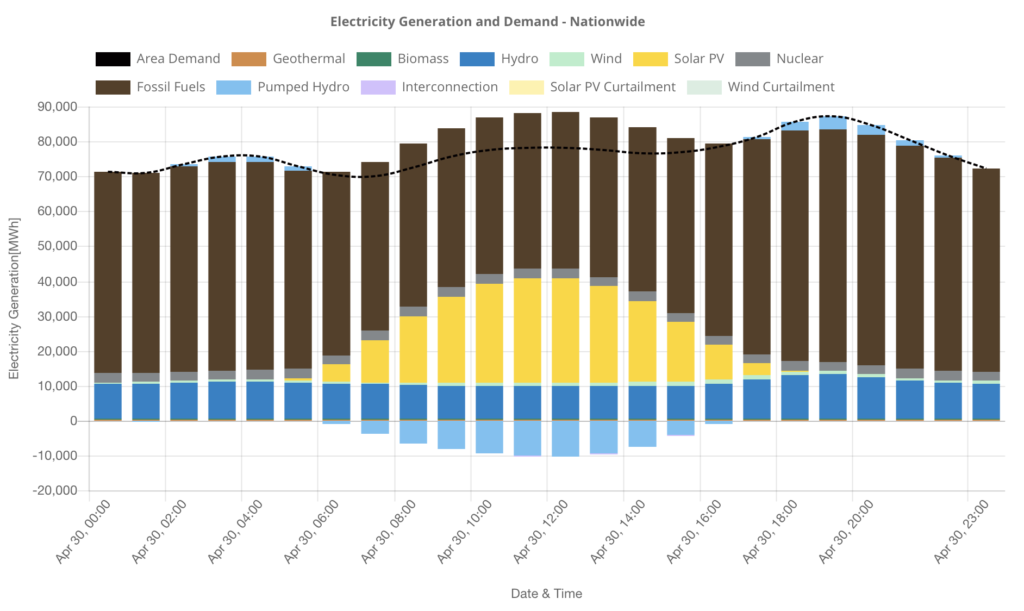
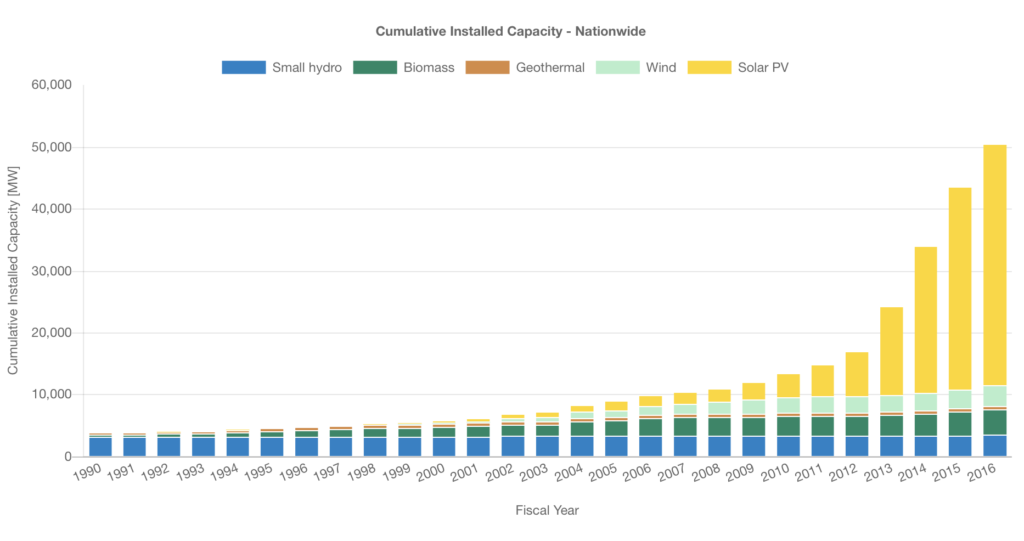
Report of a launch event of ISEP Energy Chart

On February 23rd, 2018, we held a public-open event called "Facts and Tasks that visualization…
ISEP Energy Chart2018-02-27
About ISEP Energy Chart

How to cite data and graphs from ISEP Energy Chart

Please specify the source when citing data or graphs from the ISEP Energy Chart. The…
ISEP Energy Chart2018-02-14
Cumulative Installed Capacity

The rapid development of Solar PV

In the ISEP Energy Chart “Cumulative Installed Capacity” graph, you can view the installed renewable…
ISEP Energy Chart2018-02-14
Renewable Energy Share in Electricity

RE shares in electricity demand or production

In the “RE shares in electricity demand or production” section of the ISEP Energy Chart,…
ISEP Energy Chart2018-02-14
Electricity Generation and Demand

What was the largest proportion of renewable energy in a single hour?

In the Electricity generation and demand graph, the graph of power generation from each different…
ISEP Energy Chart2018-02-14
Previous 1 … 4 5 6 7 Next

Categories

  • About ISEP Energy Chart
  • Bar Chart Race
  • Commentary
  • Cumulative Installed Capacity
  • Data Search
  • Data Update
  • Electricity Generation and Demand
  • Event
  • News
  • Renewable Energy Share in Electricity

Archives

  • April 2025
  • May 2024
  • April 2023
  • December 2022
  • October 2022
  • April 2022
  • July 2021
  • May 2019
  • February 2019
  • December 2018
  • October 2018
  • August 2018
  • July 2018
  • May 2018
  • March 2018
  • February 2018

About the ISEP Energy Chart

ISEP Energy Chart is an energy data visualization project conducted by ISEP. Interpret the rapid development of renewable energies through data analysis.

Donation

Your donation helps our continuous operation and expansion of the website.

Recent Posts

  • Global Solar and Wind Bar Chart Races 2024 Data Added 2025-04-17
  • Global Solar and Wind Bar Chart Races 2023 Data Added 2024-05-24
  • Global Solar and Wind Bar Chart Races 2022 Data Added 2023-04-04
  • August – September 2022 Data Update 2022-12-06

Copyright 2018 Institute for Sustainable Energy Policies. All rights reserved.

  • Home
  • Concept
  • Graph
    • Electricity Generation and Demand
    • Renewable Energy Share in Electricity
    • Cumulative Installed Capacity (Electricity)
    • Cumulative Installed Capacity (Heat)
    • Bar Chart Race (Solar PV)
    • Bar Chart Race (Wind)
  • Data Search
  • Blog
  • Donation
  • Contact
  • Japanese