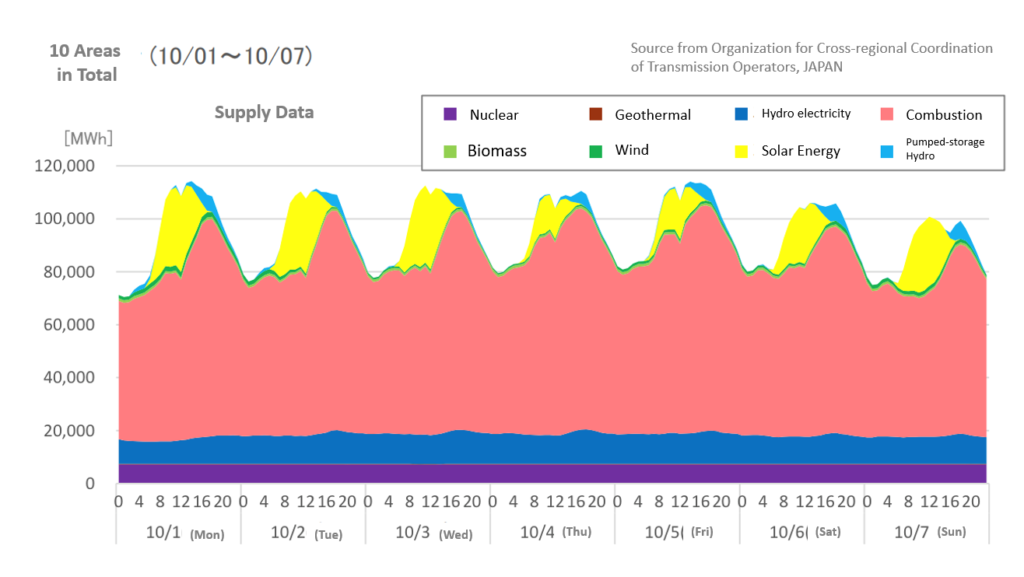
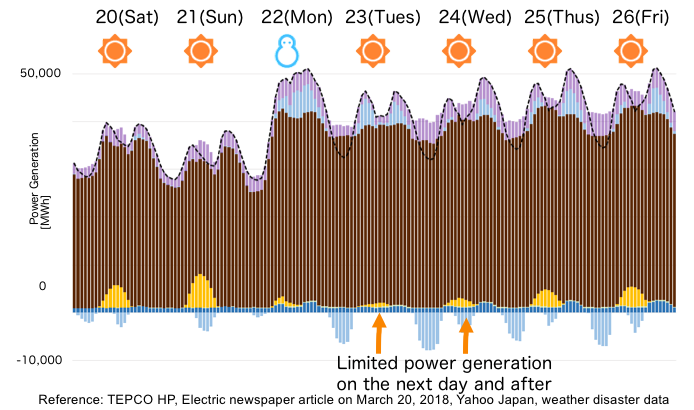
OCCTO has started to publish electricity demand data and graphs


Based on the supply data for October 2018, the Organization for Cross-regional Coordination of Transmission…
ISEP Energy Chart2018-12-12


